National Data | April Jobs: Even Democrats Doubtful About Report Showing Americans Recovering, Slightly, Against Immigrant Invasion
05/11/2014
Superficially, April’s jobs numbers looked good for the Obama Administration, but the details are (again) so weird that even liberals seem worried: Rex Nutting, MarketWatch’s dogmatically Democrat commentary editor, warned The household survey is insane| Don’t believe the drop in the unemployment rate to 6.3% (May 2)
Businesses reported adding 288,000 jobs, the unemployment rate fell while the labor force participation rate, after edging up for a few months, revisited its 35-year low. But the “other” employment survey, of households rather than businesses — the only report where immigrant and native-born American employment figures are broken out separately — reported a job loss in April. Our analysis of household survey data finds that, very unusually, immigrants bore the entire brunt of this loss.
In April:
- Total employment fell by 73,000, or by 0.05%
- Native-born American employment rose by 148,000 or by 0.12%
- Foreign-born employment fell by 221,000, or by 0.92%
But while we share Nutting’s skepticism, we have no choice but to use household survey numbers in our analysis of the April job market. Thus our New VDARE.com American Worker Displacement Index (NVDAWDI) shows a significant decline in April — falling to 108.2 from 109.4 in March.
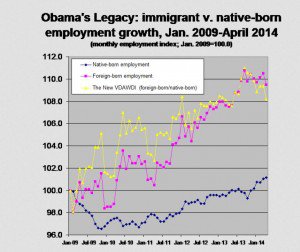
Of course, over the entire Obama era — January 2009 to April 2014 — the displacement of native-born American workers by immigrants is painfully evident in the NVDAWDI graphic:
Native-born American employment growth is the blue line, immigrant employment growth is in pink, and NVAWDI — the ratio of immigrant to native-born American job growth — is in yellow. The graphic starts at 100.0 for both native-born American and immigrant employment in January 2009, and tracks their growth since then.
From January 2009 to April 2014:
- Foreign-born employment rose by 2.050 million, or by 9.47%. The immigrant employment index rose from 100.0 to 109.5.
- Native-born American employment rose by 1.398 million or by 1.16%. The native-born employment index rose from 100.0 to 101.2.
- NVDAWDI (the ratio of immigrant to native-born American employment growth indexes) rose from 100.0 to 108.2 (100X(109.5/101.2)
| Employment Status by Nativity, April 2013-April 2014(numbers in 1000s; not seasonally adjusted) | ||||
| Apr-13 | Apr-14 | Change | % Change | |
| Foreign born, 16 years and older | ||||
| Civilian population | 37,842 | 38,391 | 549 | 1.5% |
| Civilian labor force | 24,982 | 25,127 | 145 | 0.6% |
| Participation rate (%) | 66.0% | 65.5% | -0.5 %pt. | -0.8% |
| Employed | 23,292 | 23,713 | 421 | 1.8% |
| Employment/population % | 61.6% | 61.8% | 0.2 %pt. | 0.3% |
| Unemployed | 1,690 | 1,414 | -276 | -16.3% |
| Unemployment rate (%) | 6.8% | 5.6% | -1.2 %pt. | -17.6% |
| Not in labor force | 12,860 | 13,264 | 404 | 3.1% |
| Native born, 16 years and older | ||||
| Civilian population | 207,332 | 209,049 | 1,717 | 0.8% |
| Civilian labor force | 129,757 | 129,718 | -39 | 0.0% |
| Participation rate (%) | 62.6% | 62.1% | -0.5 %pt. | -0.8% |
| Employed | 120,432 | 122,054 | 1,622 | 1.3% |
| Employment/population % | 58.1% | 58.4% | 0.3 %pt. | 0.5% |
| Unemployed | 9,325 | 7,664 | -1,661 | -17.8% |
| Unemployment rate (%) | 7.2% | 5.9% | -1.3 %pt. | -18.1% |
| Not in labor force | 77,575 | 79,330 | 1,755 | 2.3% |
| Source: BLS, The Employment Situation — April 2014, Table A-7, May 2, 2014.PDF | ||||
- Immigrants gained 421,000 jobs, a 1.8% increase; native-born American workers gained 1,622,000 positions, a 1.3% increase. ADVANTAGE IMMIGRANTS
- The labor force participation rate (LPR) fell by 0.5 percentage points for both immigrants and native-born Americans. Because immigrants have a significant larger LPR (65.5% versus 62.1% for native-born), this represents a smaller percentage decline for them. ADVANTAGE IMMIGRANTS
- The number of unemployed native-born Americans fell by 17.8%. The corresponding figure for immigrants was a decline of: 16.3%. Sounds good for Americans, but it may simply reflect the expiration of extended unemployment benefits to millions of native-born American workers. Once the checks stop, so does the illusion that they’ll find a job, and they stop looking. At that point they are no longer counted as unemployed.
Yet another reason to distrust the April Household Survey.
Edwin S. Rubenstein is President of ESR Research Economic Consultants.

