National Data | May Jobs: We Unveil The New VDAWDI
06/06/2011
A rough patch — or a double-dip recession? Economists are increasingly befuddled at what awaits the once-great U.S. economy. And Wall Street is plainly beginning to panic.
Unemployment is a case in point. It now seems obvious that one of those mysterious memos has gone out to the Main Stream Media saying that no-one can mention the immigration moratorium solution. But unemployment is befuddling anyway.
Just a few weeks ago professional prognosticators were expecting job growth of 175,000 in May. However, nonfarm payroll growth came in at 54,000 in May, the smallest gain since September, and a fraction of the just lowered consensus forecast (125,000 jobs.)
The "other" employment survey, of households rather than businesses, also broadcast mixed signals — at least so far as the prospects for native-born workers are concerned. VDARE.com has long argued that the household survey captures the employment of illegal aliens; additionally, it actually mentions ethnicity.
In May, according to the Household Survey, total employment rose by 105,000. Non-Hispanics actually gained ground:
-
Total employment: up 105,000 (+0.08 percent)
-
Non-Hispanic employment: up 190,000 (+0.16 percent)
-
Hispanic employment: down 85,000 (-0.42 percent)
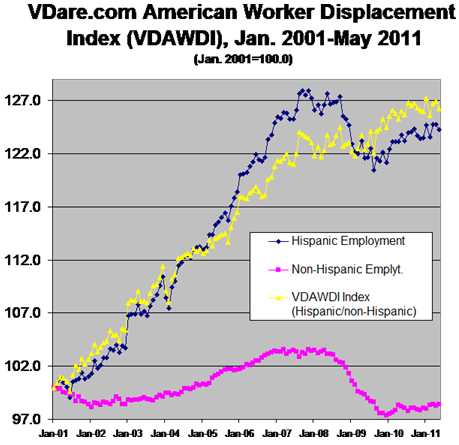
Thus VDAWDI — VDARE.com’s American Worker Displacement Index, unveiled in 2004 and still unique — fell to 126.2 in May from April’s 127.0 level.

This, of course, is atypical statistical noise. Non-Hispanics have lost jobs at twice the rate of Hispanics since the recession hit in December 2007. And since the official start of the "recovery" in June 2009, Hispanics have gained 416,000 jobs while non-Hispanics have lost 675,000 positions.
Step back further and the picture is still bleaker. Since January 2001 the number of non-Hispanics holding jobs has declined by 1.9 million, or by -1.6%. Over that same period Hispanic employment rose by 3.9 million, up a whopping 24.2%.
Simply put, the 21st century has not been good for non-Hispanic job seekers.
This Hispanic/non-Hispanic divide was, of course, a convenient proxy for VDARE.com’s primary interest: foreign-born workers and their role in displacing their native-born counterparts. We tracked this by looking at Hispanics because such a high proportion of them are foreign-born — and because the federal government declined to provide data on immigrant vs. non-immigrant unemployment.
However, since January 2010, the Bureau of Labor Statistics [BLS] has begun to publish figures for foreign-born and native-born employment. These data are not seasonally adjusted, making month to month trends difficult to interpret. BLS resolves the dilemma by comparing the current month with the same month of the prior year:
By this measure also, May 2011 is notable for some catching up on the part of native-born workers — at least when compared to the same month of 2010:
|
Employment Status by Nativity, May 2010-May 2011 |
||||
|
(numbers in 1000s; not seasonally adjusted) |
||||
|
May-10 |
May-11 |
Change |
% Change |
|
|
Foreign born, 16 years and older |
||||
|
Civilian population |
35,647 |
36,348 |
701 |
2.0% |
|
Civilian labor force |
24,210 |
24,253 |
43 |
0.2% |
|
Participation rate (%) |
67.9% |
66.7% |
-1.2%pt. |
-1.8% |
|
Employed |
22,125 |
22,216 |
91 |
0.4% |
|
Employment/population % |
62.1% |
61.1% |
-1.0%pt. |
-1.6% |
|
Unemployed |
2,085 |
2,037 |
-48 |
-2.3% |
|
Unemployment rate (%) |
8.6% |
8.4% |
-0.2%pt. |
-2.3% |
|
Not in labor force |
11,437 |
12,095 |
658 |
5.8% |
|
Native born, 16 years and older |
||||
|
Civilian population |
201,852 |
202,965 |
1,113 |
0.6% |
|
Civilian labor force |
129,656 |
129,196 |
-460 |
-0.4% |
|
Participation rate (%) |
64.2% |
63.7% |
-0.5%pt. |
-0.8% |
|
Employed |
117,372 |
117,812 |
440 |
0.4% |
|
Employment/population % |
58.1% |
58.0% |
-0.1%pt. |
-0.2% |
|
Unemployed |
12,284 |
11,384 |
-900 |
-7.3% |
|
Unemployment rate (%) |
9.5% |
8.8% |
-0.7%pt. |
-7.4% |
|
Not in labor force |
72,196 |
73,769 |
1,573 |
2.2% |
|
Source: BLS, "The Employment Situation — May 2011," June 3, 2011. Table A-7. |
Thus over the past 12 months:
- Immigrants and native-born Americans both experienced the same 0.4% job growth, with 440,000 more natives and 91,000 more immigrants at work. A TIE.
- The immigrant unemployment rate fell by 0.2 points; the native-born rate fell by 0.7 points. ADVANTAGE NATIVE-BORN.
- The share of immigrants holding jobs fell by 1.6%; the share of natives holding jobs fell by 0.2%. ADVANTAGE NATIVE-BORN.
- Labor force participation rates fell by 1.2% points for immigrants and 0.8% points for natives. ADVANTAGE NATIVE-BORN.
- The immigrant population of working age increased by 2.0%; the comparable native population grew by 0.6%. ADVANTAGE IMMIGRANTS
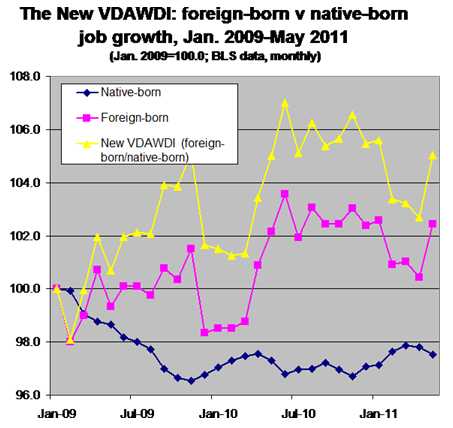
By an amazing coincidence, January 2009 — the month President Obama took office — is also the earliest month of data published in BLS’s new foreign and native-born employment table. Coincidence or not, this means we can piece together the monthly points to see the President’s priorities, or at least his practical effect.

Setting the job count at 100.0 for both native-born and immigrants in January 2009, immigrant employment ticked up to 102.9 in May — am increase of 2.9%. Native employment ticked down to 97.5 — a 2.5% decline. We label this "The New VDAWDI".
From January 2009 through May 2011 the New VDAWDI, calculated using foreign-born and native-born employment figures, grew by 5.5%. By comparison VDAWDI, calculated using Hispanic and non-Hispanic employment figures, rose by 3.3% over the same period. As we've found before, our older measure of American Worker Displacement understated the problem.
In all but a few months of the Obama Administration, native-born workers have lost ground to immigrants
Time is running out for native-born workers — a.k.a. Americans.
Can the same be said for the Obama Administration?
Edwin S. Rubenstein is President of ESR Research Economic Consultants in Indianapolis.