

11/07/2016
Immigrant displacement of American workers close to a record high, black unemployment jumps and a new immigration surge is underway — right in time for the election.The government, in its last pre-election snapshot of the economy, reported that employers added 161,000 workers in October. The official unemployment rate dropped to 4.9 percent, from 5 percent. And average hourly earnings rose 2.8 percent year over year, a level not reached since 2008.
The MSM saw as presaging a healthy outlook for the months ahead. “It was pretty positive across the board,” said David Berson, chief economist at Nationwide Insurance.[ Last Economic Snapshot Before The Election Shows Healthy Job Growth, By Patricia Cohen, NYT, November 4, 2016,
Apparently Mr. Berson does not scrutinize the part of Household Employment Survey where data are reported by race and nativity. There he would have seen that seasonally-adjusted unemployment among Black men 20 years and older rose in October (to 8.6% from 8.3% the prior month) while Hispanic men in that age bracket enjoyed a decline (to 5.0% from 5.4% in September). Seasonally adjusted unemployment among white men held steady at 4.1% in September and October.

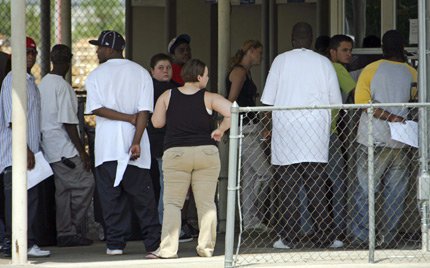
This pattern is consistent with the displacement of black workers by low wage, primarily Hispanic, immigrants.[After Immigration Raid, Locals Line Up For Jobs, NPR, August 28, 2008]
Even the macro picture of continued job growth is belied by the latest Household Survey results.
In October:
Native-born American employment growth is represented by the black line, immigrant employment growth is in pink, and NVAWDI — the ratio of immigrant to native-born job growth — is in yellow. The index starts at 100.0 in January 2009 for both immigrants and native-born Americans, and tracks their employment growth since then.
From January 2009 through October 2016:
The foreign-born share of total U.S. employment has risen steadily, albeit erratically, during the Obama years:
In Barak Obama’s first full month in office (February 2009) 14.97% of all persons working in the U.S. were foreign-born. The foreign-born share in October was 17.05%, the fifth highest among the 94 months of Mr. Obama’s administration. The Obama era high, 17.216%, was set in September 2016.
Seven of the 10 worst months for native-born workers in the Obama years (measured by the share of jobs held by immigrants) have occurred in 2016.
The foreign-born share of total employment in September was 2.23 percentage points above the level recorded in February 2009. With total employment now at 152.0 million, this implies that Obama-era immigration may have pushed as many as 3.39 million native-born Americans onto the unemployment rolls since then.
A detailed snapshot of American worker displacement over the past year is seen in the Employment Status of the Civilian Population by nativity table published in the monthly BLS Report. [PDF]
| Employment Status by Nativity, Oct. 2015-Oct. 2016 | ||||
| (numbers in 1000s; not seasonally adjusted) | ||||
| Oct-15 | Oct-16 | Change | % Change | |
| Foreign born, 16 years and older | ||||
| Civilian population | 40,074 | 41,785 | 1,711 | 4.3% |
| Civilian labor force | 26,267 | 27,060 | 793 | 3.0% |
| Participation rate (%) | 65.5 | 64.8 | -0.7%pts. | -1.1% |
| Employed | 25,120 | 25,965 | 845 | 3.4% |
| Employment/population % | 62.7 | 62.1 | -0.6%pts. | -1.0% |
| Unemployed | 1,147 | 1,096 | -51 | -4.4% |
| Unemployment rate (%) | 4.4 | 4.0 | -.0.4%pts. | -9.1% |
| Not in labor force | 13,807 | 14,725 | 918 | 6.6% |
| Native born, 16 years and older | ||||
| Civilian population | 211,468 | 212,536 | 1,068 | 0.5% |
| Civilian labor force | 131,047 | 132,722 | 1,675 | 1.3% |
| Participation rate (%) | 62.0 | 62.4 | 0.4%pts. | 0.6% |
| Employed | 124,597 | 126,370 | 1,773 | 1.4% |
| Employment/population % | 58.9 | 59.5 | 0.6%pts. | 1.0% |
| Unemployed | 6,450 | 6,352 | -98 | -1.5% |
| Unemployment rate (%) | 4.9 | 4.8 | -0.1%pts. | -2.0% |
| Not in labor force | 80,421 | 79,814 | -607 | -0.8% |
| Data source: BLS, The Employment Situation — October 2016, Table A-7, November 4, 2016. | ||||
Over the last 12 months (October 2015 to October 2016):
Once again the data seem to suggest an immigration surge is underway. BLS estimates that the foreign-born population of working age (16 years and over) grew by 4.3% over the past 12 months, or roughly 9 times the 0.5% growth of the comparable native-born American population.
In raw numbers, the foreign-born working age population reportedly rose by 1.711 million over the past 12 months — far larger than the 1 million that the Department of Homeland Security reports are granted Legal Permanent Resident status in a typical year.

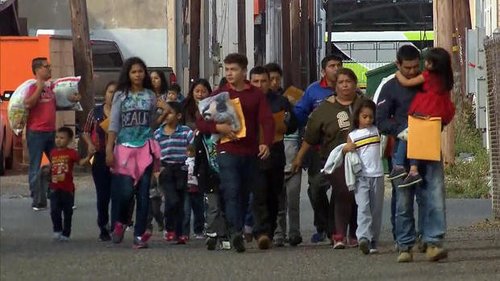
Surge of migrants illegally crossing U.S.-Mexico border ahead of election, By Manuel Bojorquez CBS News, October 25, 2016
Are illegals filling the gap? I’ve been writing about this since last year. Now, finally, reports of a border surge have started to appear in the MSM — right in time for the election.
Edwin S. Rubenstein is President of ESR Research Economic Consultants.