By Jared Taylor
04/28/2012
American Renaissance, April 26, 2012

Bureaucrats and “scholars” are blind to the facts.
In mid-March, the Department of Education reported that black and Hispanic students are suspended from school at higher rates than whites. This has been known for years, but every time it is reported there is outrage. Education Secretary Arne Duncan worried about the “the most alarming findings.” He lamented that “minority students across America face much harsher discipline than non-minorities, even within the same school,” adding that “the everyday education experience for too many students of color violates the principle of equity at the heart of the American promise.”
The secretary did warn that “overt discrimination” might not fully account for these differences, but others were not so cautious. The National Education Policy Center at the University of Boulder announced that “researchers have found no evidence that students of color engage in more misbehavior than White students,” which leaves discrimination as the only culprit. Judith Browne Dianis, co-director of a minority-oriented organization called the Advancement Project, explained that “there’s bias in classrooms.” She added that “there’s also this perception of children of color as being criminals.” The Chicago Teachers Union responded to the report by saying that “the data lends further credibility” to its belief that school practices “amount to educational apartheid for a significant number of students.” The media appeared to quote no one who pointed out that racial differences in suspension rates might simply reflect differences in offense rates.
The Department of Education’s study, unaccountably titled “Revealing New Truths About Our Nation’s Schools,” presented the data graphically:
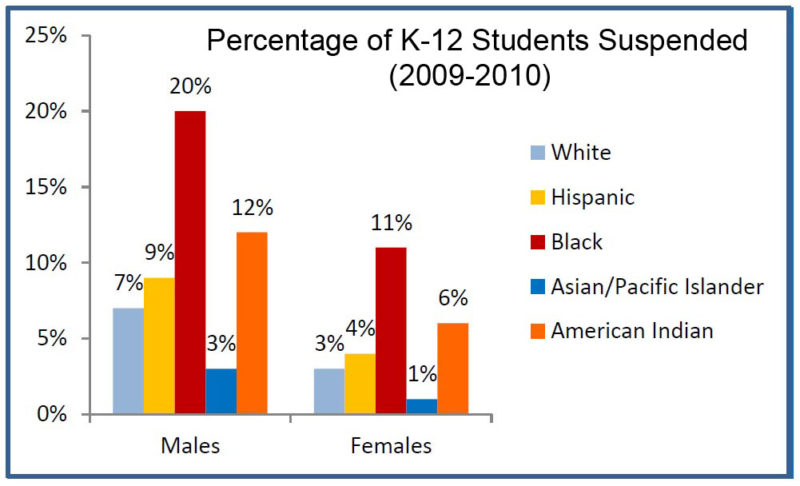
Black boys are indeed, suspended at about three times the rate for white boys, and black girls at nearly four times the white rate. However, every account of these findings ignored the fact that, as study after study has shown, Asians are suspended less often than whites. If it is “alarming” that black boys are suspended at three times the rate for white boys, why is it not “alarming” that white girls are suspended at three times Asian rate?
Boys are at least twice as likely to be suspended as girls, but no one talks about that either. Everyone knows that boys behave worse than girls, but to acknowledge sex differences in behavior might suggest the possibility of race differences. Correction: Almost everyone understands this. The Southern Poverty Law Center worried that the data “raise important questions about … the possibility of conscious or unconscious racial and gender biases at the school level.” (emphasis added)
Just a few weeks after its report on suspension rates, the Department of Education issued a joint report with the Department of Justice called Indicators of School Crime and Safety: 2011. It got a bit of press attention, too, mainly for pointing out that although there were more than 1,000,000 violent crimes committed at American public schools, only about 300,000 are reported to the police.
What went unremarked were the race data in the report, which flatly contradict the view that there are no race differences in levels of misbehavior at school. Secretary Arne Duncan, who expressed such alarm over suspension rates, ignored the race data. You have to dig for the information, and it is not presented in pretty bar graphs like the suspension rates, but the picture is clear.
Table 7.1, for example, deserves serious study (click on the figure to see an enlarged version).
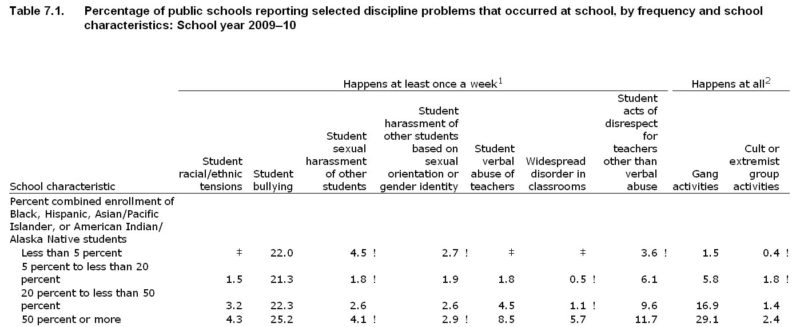
This table is the result of polling teachers about the problems they have in their schools. The schools are in four categories, according to the number of students who are non-white. Translated into terms that make more sense, the top row schools are at least 95 percent white. The second row schools are 80 to 95 percent whites, the third row are 50 to 80 percent white, and the fourth row are less than 50 percent white. The numbers in the rows are the percentages of these schools that have the kinds of problems described along the top horizontal axis. The ‡ and ! symbols mean that the reported numbers are so low they are meaningless or that sample sizes are unreliable.
The first thing to notice is that aside from sexual and sexual-orientation harassment and bullying, every category gets consistently worse as a school gets less white. To take the first category — racial or ethnic tensions — schools that are 95 percent or more white essentially do not suffer from that problem at all. Not surprisingly, racially mixed campuses do. No less than 4.5 percent of majority non-white schools have racial/ethnic problems at least once a week.
There are similar patterns with “student verbal abuse of teachers” and “widespread disorder in the classroom.” There are essentially no all-white schools where this happens as often as once a week, but the percentages grow as the student body gets less white. Schools with a lot of “verbal abuse of teachers” and “widespread disorder in the classroom” sound like schools where suspensions might be more common.
The report does not explain what is meant by “student acts of disrespect for teachers other than verbal abuse,” but it undoubtedly includes behavior — hitting a teacher, for example? — that merits suspension. The less white the school, the more of this there is. “Gang activities” — and might these not also require firm discipline? — are no less than 19 times more common in white-minority schools than in schools that are all- or nearly all-white. This table by itself gives the lie to the notion that all races behave in the same way.
And even the categories of offence that appear to be as common in white schools as in non-white schools may not be. Is it unreasonable to assume that what is flagged as bullying or sexual harassment in an all-white school with very few behavior problems is simply overlooked in a majority non-white school with gang activity and “widespread disorder in the classroom”?
Table 6.5 contains eye-opening information, too.

The “serious violent incidents” in this table are the real thing: rape, robbery, and actual or threatened attack with a weapon. There are some deviations from perfect correlation, but the trend is clear: White schools have fewer serious violent incidents (the # sign means “rounds to zero). If there is anything that deserves suspension, it is surely violent crime, and violent crime increases as the number of non-whites increases.
Figure 13.2 shows who is fighting in schools. This is one of the rare visual representations of race-related data in this report, and the findings are consistent with suspension patterns: Blacks fight more than Hispanics, who fight more than whites, who fight more than Asians.
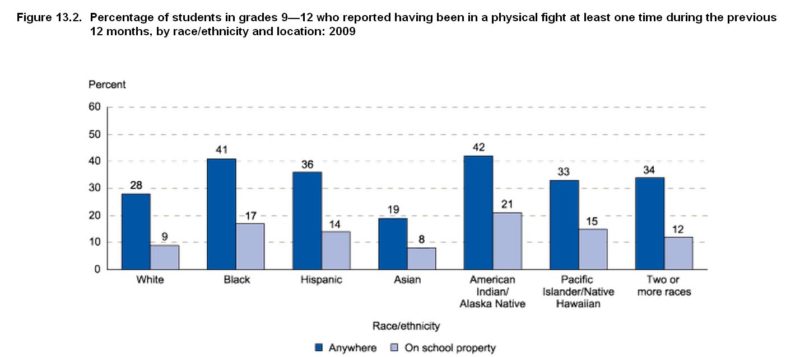
Table 13.2 goes into more detail on fighting. Blacks are twice as likely as whites, for example, to have been in four to 11, or 12 or more fights in the past year.

The other government department — the Department of Justice — that helped write Indicators of School Crime and Safety: 2011 has useful information, too. If there are no racial differences in misbehavior rates in school, there should be no racial differences in juvenile arrest rates. DOJ data prove otherwise.
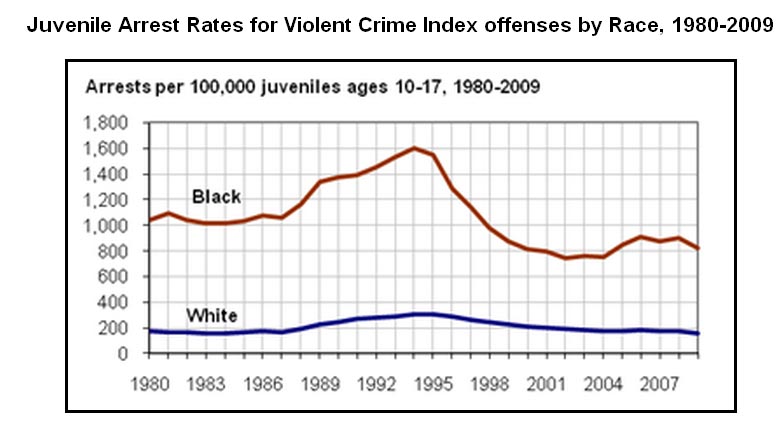
Again, these are juvenile arrest rates for the very worst offenses: murder, nonnegligent manslaughter, forcible rape, robbery, and aggravated assault. In its usual, unhelpful way, DOJ lumps most Hispanics together with whites rather than break them out as a separate group, thus inflating white offense rate. This means the black/white gap is even greater than what is depicted here. Even with Hispanics included with whites, in 2009, black juveniles between the ages of 10 and 17 were four times more likely than white juveniles to be arrested for serious, violent crime.
There are still a few people who believe that arrest rates do not reflect offense rates; that prejudiced cops arrest innocent blacks. Such people forget that violent crimes short of murder usually have witnesses, and that the police arrest perpetrators who match victims’ descriptions. For police bias to cause race gaps of this magnitude, we would have to imagine the police arresting blacks even when the victim said the attacker was white, or refusing even to look for the perp if the victim said he was white. This is absurd.
DOJ has data on race differences in arrest rates for other crimes. The gaps for murder and robbery, for example, are particularly large.

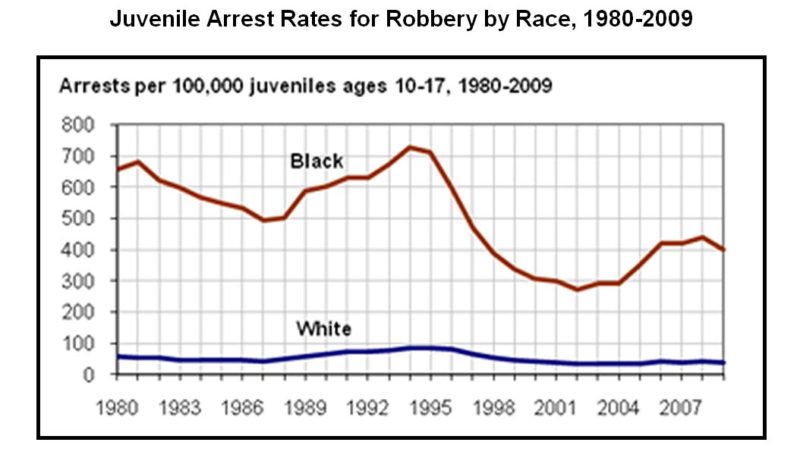
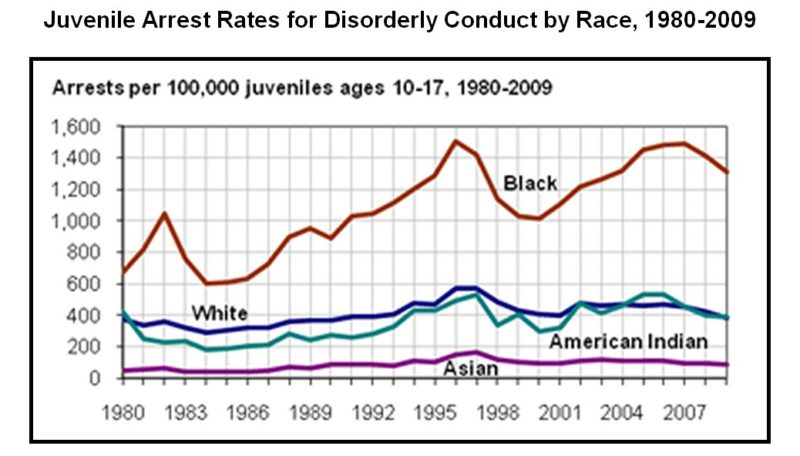
The data on juvenile arrests for disorderly conduct includes Asians and Americans Indians. They bear out the consistent pattern of very low Asian offense rates.
It would be wrong to assume that blacks top the arrest rates for all crimes. As this chart shows, young whites and Indians are arrested far more often than blacks for breaking liquor laws.
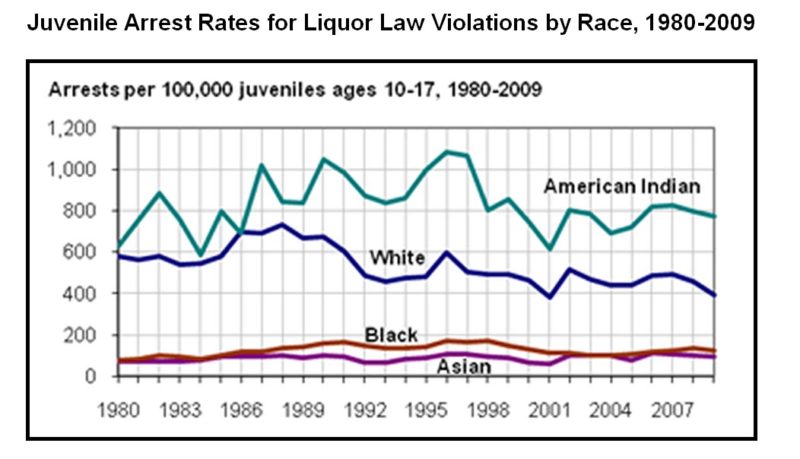
Race differences in rates of arrest for drinking offenses further discredit the notion that “racist” police unfairly target blacks. Public or under-age drinking is an offense for which the police have enormous leeway on whether to make an arrest. Unlike the pressure on police to arrest violent criminals, the public does not much care whether there are arrests of under-age drinkers. That means liquor-law violations would be a perfect opportunity to exercise police “racism:” Arrest the blacks and ignore the whites. Instead, whites (and Indians) are arrested more often for these offenses because they commit more of them than blacks or Asians. DOJ’s arrest rates confirm reports from schools: Different groups behave differently.
Readers will recall that the National Education Policy Center at the University of Boulder claims that there is “no evidence” that blacks commit crimes at higher rates that whites. Daniel J. Losen, who made that claim, is either a fool or a liar; perhaps both. Secretary of Education Arne Duncan, who makes much of racial differences in suspension rates but ignores his own department’s well established data that explain those differences, is, at best, deceitful.
Propaganda of this kind puts unfair pressure on teachers and administrators who may well be disciplining students as fairly as possible. There may be legitimate debate as to whether school suspension cures misbehavior or about how specific offenses should be punished, but to pretend that there are no race differences in student behavior — and to blame “prejudiced” teachers for differences in suspension rates — is contemptible. People who make these claims do not care about facts. They ignore anything that contradicts their blinkered conception of blacks (and now Hispanics) as perpetual victims and whites as perpetual oppressors.
Nor is it the job of the media to swallow whatever Arne Duncan tells them. Why did not even one mainstream account of the DOE study point out the obvious: that different groups are disciplined at different rates because they behave differently? Reporters who pass along deceit are as contemptible as the bureaucrats and “scholars” who feed it to them.
This is a content archive of VDARE.com, which Letitia James forced off of the Internet using lawfare.