

By Steve Sailer
02/12/2021
Here’s a theory: trends in the national murder rate are positively correlated with trends in bad driving, perhaps due to either the police retreating to the donut shop or to public exuberance.
I haven’t tested it because it sounds like it would be a lot of work to get really familiar with traffic stats.
Historically in NYC, the homicide stats have moved in almost lockstep with traffic fatalities. They both collapsed in the 90s. I think they both are a measure of social chaos. Not sue what the national numbers show …
— rad-center (@rad_center) February 12, 2021
My vague impression of the causes of the huge increase in murders during the Racial Reckoning following the death of George Floyd was that it was due in part not just to the usual reasons — the police retreating to the donut shop and/or the decline in black trust of the police and/or black rage — but also due to black exuberance over America declaring that blacks (excuse me, Blacks) were totally awesome and could do no wrong. When I watch videos of black youths looting, they mostly look like they are having a blast.

https://x.com/rad_center/status/1360109918624370688?ref_src=twsrc%5Etfw%7Ctwcamp%5Etweetembed%7Ctwterm%5E1360109918624370688%7Ctwgr%5E%7Ctwcon%5Es1_c10&ref_url=https%3A%2F%2Fwww.unz.com%2Fisteve%2Fa-hypothesis-murders-and-bad-driving-trend-together%2F
My unquantified impression is that there were an exceptional number and magnitude of black-on-black shootings at parties last summer, such as the August 9 party in Washington D.C. in which 22 people were shot, only 1 fatally. You can see the enormous kink upward in mass shootings (4 or more killed or wounded) during the racial reckoning in the graph above of cumulative shootings in 2020 vs 2016–2019.
One issue with my murder correlates with bad driving is that the shootiest black neighborhoods tend to have the fewest drivers per capita.
Update from Car & Driver:
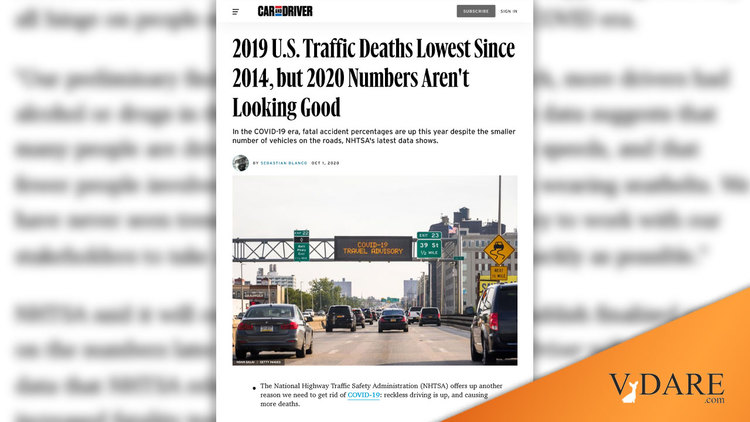
2019 U.S. Traffic Deaths Lowest Since 2014, but 2020 Numbers Aren’t Looking Good
In the COVID-19 era, fatal accident percentages are up this year despite the smaller number of vehicles on the roads, NHTSA’s latest data shows.
BY SEBASTIAN BLANCO
OCT 1, 2020The National Highway Traffic Safety Administration (NHTSA) offers up another reason we need to get rid of COVID-19: reckless driving is up, and causing more deaths.
2019 was the third year in a row with fewer traffic fatalities than the one before,
Following the Late Obama Age Collapse in road and especially pedestrian safety during the Ferguson Effect years of 2015–2016, much as murders were down from the 2016 peak in the first three Trump years.
but NHTSA’s preliminary data for 2020 suggests more deaths per miles traveled, even with fewer cars on the road.
NHTSA said the reasons include more risky behavior, like an increase in speeding and a lower rate of seatbelt use, as well as a higher likelihood of drugs or alcohol being involved.
There’s good news and really bad news in a batch of reports released today by the National Highway Traffic Safety Administration (NHTSA) focusing on motor-vehicle traffic fatalities in 2019 and the first half of 2020. The good news is that, overall, roads were safer in 2019 than 2018, continuing a three-year trend that started in 2017. The really bad news is that, if the agency’s early estimates bear out, U.S. roads were more dangerous in the second quarter of 2020 than they have been in years.“2019 was one of the best years for highway safety so far, and we want to get back to where we were as soon as we can,” NHTSA deputy administrator James Owens said as he discussed the results today.
In hard numbers, 2020 looks pretty good so far compared to 2019. The number of people who have died in motor vehicle traffic crashes was down from 16,988 in 2019 to 16,650 in 2020, a decrease of 2 percent. The trouble with relying on just one number is that those deaths hide the massive societal changes the world went through this spring (and is still going through) with the coronavirus.
When you factor in an important aspect of that change, vehicle miles traveled (VMT), you actually see that more people died this year, on average, than last year. That’s because VMT was down a dramatic 16.6 percent (or 264.2 billion miles) in the first six months of 2020, which pushed up the fatality rate per 100 million VMT, a metric the NHTSA uses to more accurately compare vehicle and road safety over time. Using this number, the NHTSA discovered that fatalities per 100 million VMT climbed to 1.25 in 2020, up from the 1.06 in 2019, despite the same three-year decrease that the agency saw with fatalities-per-VMT that it did with overall fatalities leading into this year.
So fatalities per mile driven were up 18% in 2020 over 2019, while murders were up perhaps about 30%.