

04/01/2020
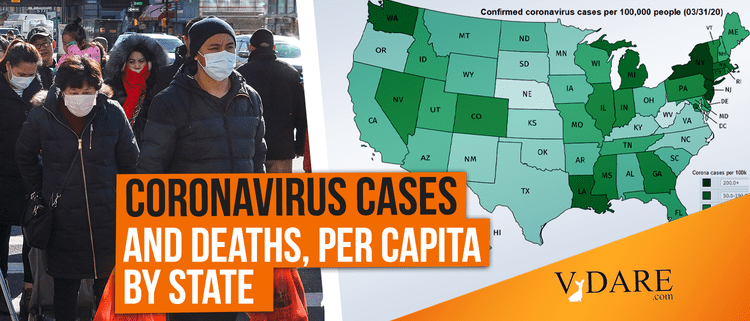
Confirmed coronavirus cases per 100,000 people as of March 31, 2020:

| State | Cases/100k |
| New York | 389.7 |
| New Jersey | 210.5 |
| Louisiana | 112.7 |
| Massachusetts | 95.2 |
| Michigan | 76.4 |
| Connecticut | 72.1 |
| District of Columbia | 70.1 |
| Washington | 68.1 |
| Illinois | 47.0 |
| Rhode Island | 46.1 |
| Colorado | 45.6 |
| Vermont | 41.0 |
| Pennsylvania | 38.8 |
| Nevada | 36.1 |
| Georgia | 35.3 |
| Delaware | 32.8 |
| Indiana | 32.1 |
| Mississippi | 31.5 |
| Florida | 29.5 |
| Maryland | 27.5 |
| Utah | 25.1 |
| Tennessee | 24.0 |
| Wisconsin | 23.2 |
| Idaho | 23.2 |
| New Hampshire | 23.1 |
| Maine | 22.5 |
| Missouri | 21.6 |
| Alabama | 19.4 |
| California | 19.1 |
| Ohio | 18.8 |
| South Carolina | 18.0 |
| Arizona | 17.8 |
| Montana | 17.3 |
| Arkansas | 16.8 |
| Wyoming | 16.4 |
| Alaska | 16.3 |
| North Dakota | 16.0 |
| Iowa | 15.8 |
| Kansas | 14.9 |
| Virginia | 14.6 |
| North Carolina | 14.6 |
| Hawaii | 14.4 |
| Oregon | 14.4 |
| Oklahoma | 14.3 |
| New Mexico | 13.4 |
| South Dakota | 12.2 |
| Texas | 11.3 |
| Minnesota | 11.2 |
| Kentucky | 10.7 |
| Nebraska | 9.6 |
| West Virginia | 8.1 |
Coronavirus-attributed deaths per one million people:

| State | Deaths/mil |
| Louisiana | 51.6 |
| New Jersey | 30.1 |
| Washington | 29.3 |
| New York | 28.3 |
| Michigan | 26.4 |
| Vermont | 19.2 |
| District of Columbia | 12.8 |
| Georgia | 10.2 |
| Connecticut | 10.1 |
| Colorado | 8.9 |
| Massachusetts | 8.8 |
| Illinois | 8.3 |
| Rhode Island | 7.6 |
| Indiana | 7.4 |
| Delaware | 7.2 |
| Mississippi | 6.7 |
| Nevada | 5.8 |
| Oklahoma | 5.8 |
| Pennsylvania | 5.4 |
| Ohio | 4.7 |
| North Dakota | 3.9 |
| California | 3.9 |
| Idaho | 3.9 |
| Oregon | 3.8 |
| Wisconsin | 3.8 |
| Montana | 3.7 |
| Maine | 3.7 |
| Florida | 3.6 |
| South Carolina | 3.5 |
| Kansas | 3.4 |
| Arizona | 3.3 |
| Virginia | 3.2 |
| Maryland | 3.0 |
| Alaska | 2.7 |
| Kentucky | 2.7 |
| Alabama | 2.7 |
| Arkansas | 2.3 |
| Missouri | 2.3 |
| Iowa | 2.2 |
| New Hampshire | 2.2 |
| Minnesota | 2.1 |
| New Mexico | 1.9 |
| Tennessee | 1.9 |
| Texas | 1.7 |
| Nebraska | 1.6 |
| Utah | 1.2 |
| South Dakota | 1.1 |
| North Carolina | 0.9 |
| West Virginia | 0.6 |
| Hawaii | 0.0 |
| Wyoming | 0.0 |
There aren’t any obvious demographic patterns that jump out to me. The correlation between confirmed cases and deaths is 0.86–not perfect, but close enough to assume states are largely on the same page when it comes to tracking the virus at this point.
The Northeast is getting crushed while the central corridor is getting off pretty easily. My mental map had California under siege, but that’s because media reporting has states ordered by absolute cases and deaths rather than by the rates of each (hence the impetus for creating the maps and tables). California is faring relatively well.