Chettynomics: Raj Chetty’s "Radical Plan" For Harvard Economics
By Steve Sailer
05/25/2019
From Vox:
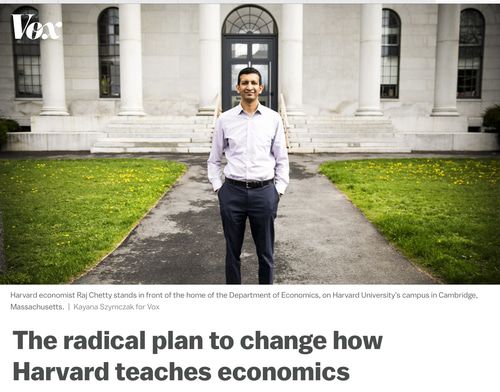
The radical plan to change how Harvard teaches economics
Raj Chetty has an idea for introducing students to econ that could transform the field — and society.
By Dylan Matthews@dylanmatt Updated May 22, 2019,
If Harvard has a most famous course, it’s Economics 10.
Not Math 55?
The introductory economics class is reliably one of the most popular courses offered to undergraduates. It’s usually taught in a massive Hogwartsian auditorium, where hundreds of students either dutifully take notes or mess around on laptops as one of the school’s star economists leads them through the basics of supply and demand.
Because Harvard has a tendency to set the pattern for other universities, Ec 10’s textbook is a massive best-seller, used at dozens of other schools, earning its author, professor Greg Mankiw, an estimated $42 million in royalties since it was first released in 1998. Mankiw’s introduction to economics has set the tone not just at Harvard but for how Econ 101 is taught across the country.
Mankiw’s textbook covers the abstract theory that underpins economics as it has been understood for decades. It is about supply and demand, about how prices can be used to match production of a good to its consumption, and about the power of markets as a tool for allocating scarce resources. Students in Ec 10 are asked to plot supply and demand curves, to solve simple word problems about what happens when the mayor of Smalltown, USA, imposes a tax on hotel rooms.
The idea is to impart a basic theory, to lay a foundation for understanding how society works. And that theory strongly implies that markets tend to work without much intervention, and that things like minimum wages might hurt more than help.
But another Harvard economist has a different idea of how to introduce students to economics.
Raj Chetty, a prominent faculty member whom Harvard recently poached back from Stanford, this spring unveiled “Economics 1152: Using Big Data to Solve Economic and Social Problems.” Taught with the help of lecturer Greg Bruich, the class garnered 375 students, including 363 undergrads, in its first term. That’s still behind the 461 in Ec 10 — but not by much.
The courses could hardly be more different. Chetty has made his name as an empirical economist, working with a small army of colleagues and research assistants to try to get real-world findings with relevance to major political questions. And he’s focused on the roots and consequences of economic and racial inequality. He used huge amounts of IRS tax data to map inequality of opportunity in the US down to the neighborhood, and to show that black boys in particular enjoy less upward mobility than white boys.
On the other hand, Chetty’s not very good at noticing interesting patterns in his data. He tends to come up with dull platitudes, which I guess is safe for his career, but kind of a shame when you consider how rich his databases should be for anyone skilled at pattern recognition and at noticing connections between data and the real world.
For example, here’s my 2018 Taki’s Magazine analysis of his data on black income.
My 2017 column “Lost Edisons” on Chetty’s “Lost Einsteins” to find all the black and Hispanic inventors out there somewhere.
My 2017 analysis of Chetty’s data on income by college.
My big 2015 re-analysis of Chetty’s data on the best place to live for your children’s sake: “Moneyball for Real Estate.”
I encourage anybody who likes to analyze social statistics to check out his databases at:
https://opportunityinsights.org/
Of course, Matthews misses the point that Chetty’s quantitative methods in big data analysis course is extremely different from Mankiw’s microeconomic theory course. That’s like saying that this amazing new course, Shakespeare 201, is revolutionizing how English is taught by offering a radical alternative to Composition 101. No, they’re different courses on different topics.
A lot of what Chetty does is closer to my old career, market research, than it is to economics. For example, Matthews writes:
“big chunk of Chetty’s lecture focused on his paper with Adam Looney and Kory Kroft on sales tax salience, the one for which they plastered new sales tax-inclusive price tags on hairbrushes and makeup at a number of California grocery stores. … But most of Chetty’s discussion of the paper was about his methodology, what’s known in economics as a “differences in differences” approach. The key was to compare how sales of unaffected products in the stores changed from the start (26.48 sold per week) to the end (27.32 sold per week) of the experiment to how sales of affected products with the new label changed: from 25.17 per week to 23.87 per week.”
That’s exactly what I was doing for a living at a marketing research firm in the early 1980s: running test markets with a test cell and a control cell and reporting results to consumer packaged goods firms exactly like that. (We actually had a far more sophisticated system for running test markets in 1982 than Chetty has today.)
Probably why I’m so much better than Chetty at making sense of Chetty’s own data is my long experience in American market research gave me a toolkit for thinking about his data superior to what economics provided Chetty with.
