

By Paul Kersey
06/24/2017
Sometimes you find a sliver of data, a piece of a puzzle you thought was permanently missing.
In New Orleans, a 60 percent black city, long have I looked for police data on the race of suspects involved in homicides and nonfatal.
Again, if — via pattern recognition — observable facts can be gathered regarding a particular racial groups penchant for violence, then wouldn’t it be prudent to pass laws protecting other (docile) racial groups from this wanton chaos?

Wait … those laws did exist once to protect white southerners.
Anyway, the puzzle piece was found. It’s called the MAYOR’S STRATEGIC COMMAND TO REDUCE MURDERS 2012-2013 Summary Report: Murders and Non-Fatal Shootings New Orleans, LA .
In it, we learn some important facts:


Murder VictimsAs illustrated in Graph 25 (below) and Graph 26 (page 42), victims were predominantly male (88.2%) and African-American (91.9%). Across all victims, the mean age was 30.0 years (median: 27.0, range: 1-99). About one-fifth of victims (19.7%) were under the age of 21, 36.7% were aged 21-29, 43.6% were aged 30 years of age or older (see Graph 27 on page 42).
The majority of victims had a documented history of ever being arrested (79.8%; see Graph 28 on page 43), about half had ever been arrested on a drug-related charge (54.6%; see Graph 29 on page 43), slightly less than a third had ever been arrested on a gun-related charge (30.3%; see Graph 30 on page 44), and 12.4% had been convicted of a gun-related charge (see Graph 31 on page 44).
Murder Suspects (based on cleared 2012-2013 cases through January 6, 2014)
As seen in Graph 32 (below), 37.6% of murders that occurred in 2012-2013 were cleared as of January 6, 2014 (includes cases cleared by arrest, warrant, or indictment; officer-related shooting; or suicide)4. Almost half (44.5%) of the murdered victims had no identified suspects as of this date, while 17.9% of murder victims had an identified suspect who had not yet been charged. In all, 157 unique suspects had been arrested for 2012-2013 murders as of January 6, 2014. These arrests cleared 129 murder victims across 119 unique incidents.
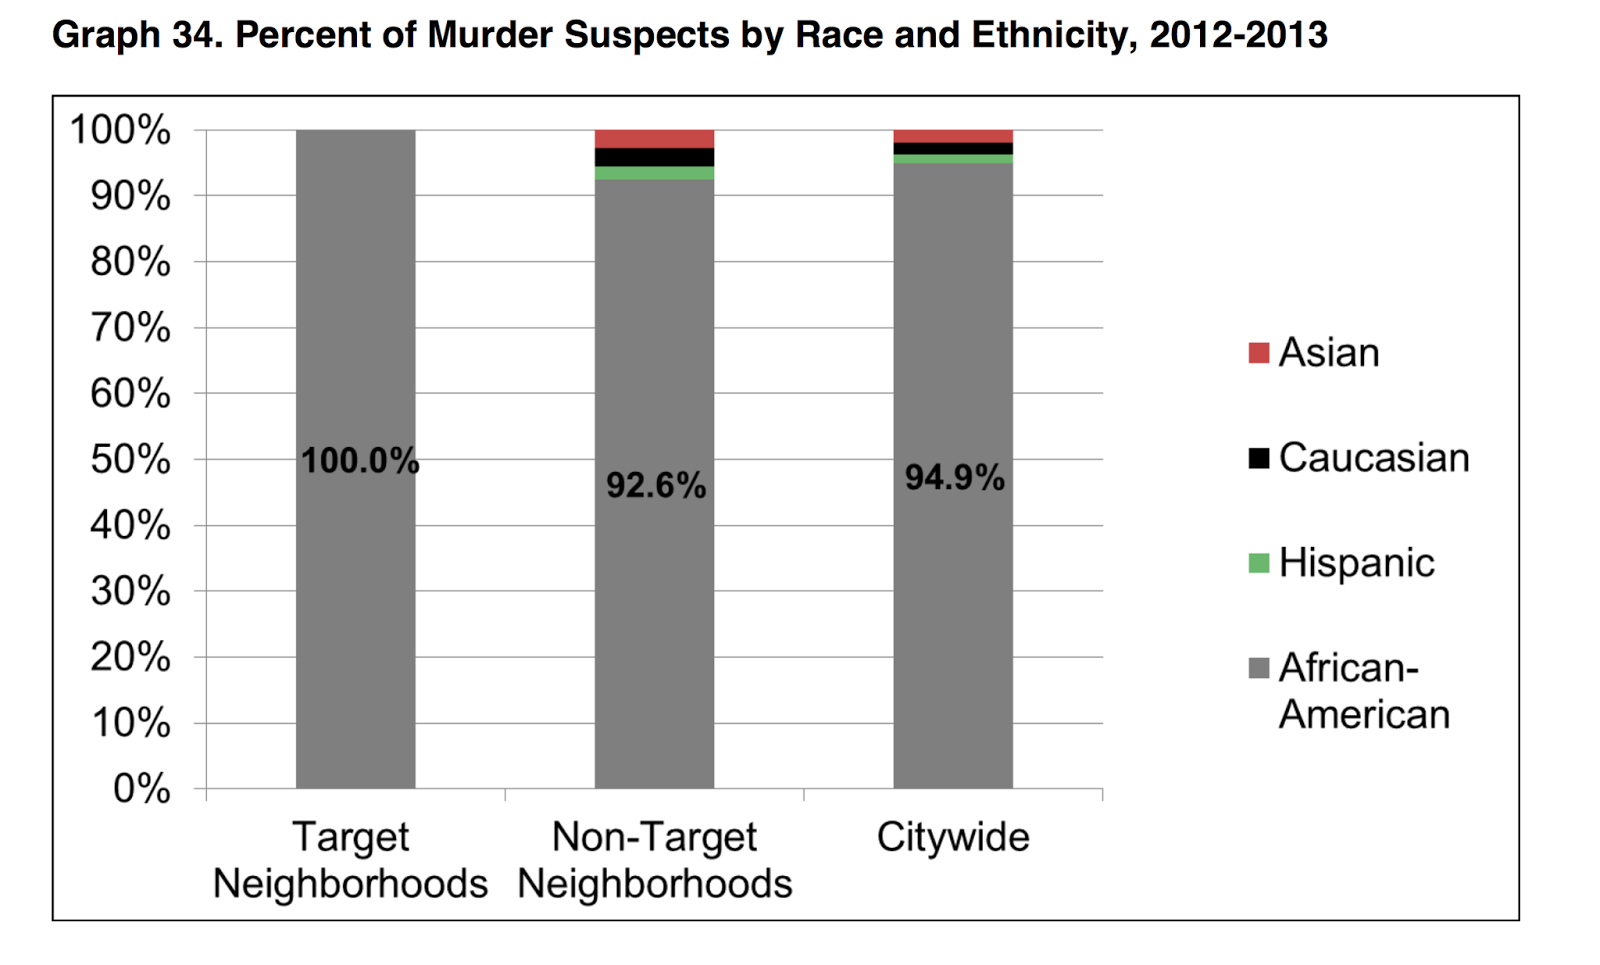
As shown in Graph 33 (page 46), most suspects who were arrested for a murder that occurred in 2012-2013 were male (86.6%) and African-American (94.9%; see Graph 34 on page 46). Over two-fifths of the suspects (42.0%) were under the age of 21 (median=22.0 years; mean=24.0 years; range: 14-55) (see Graph 35 on page 47). We also examined the age difference of victims and suspects (see Graph 36 on page 47). Two-thirds (65.5%) of suspects were younger than their victims, 6.5% were the same age, and 28.0% were older than their victims. On average, suspects were 5.1 years younger than their victim (median: 5.0 years younger; range: -48 to +38 years).
Non-Fatal Shooting Victims
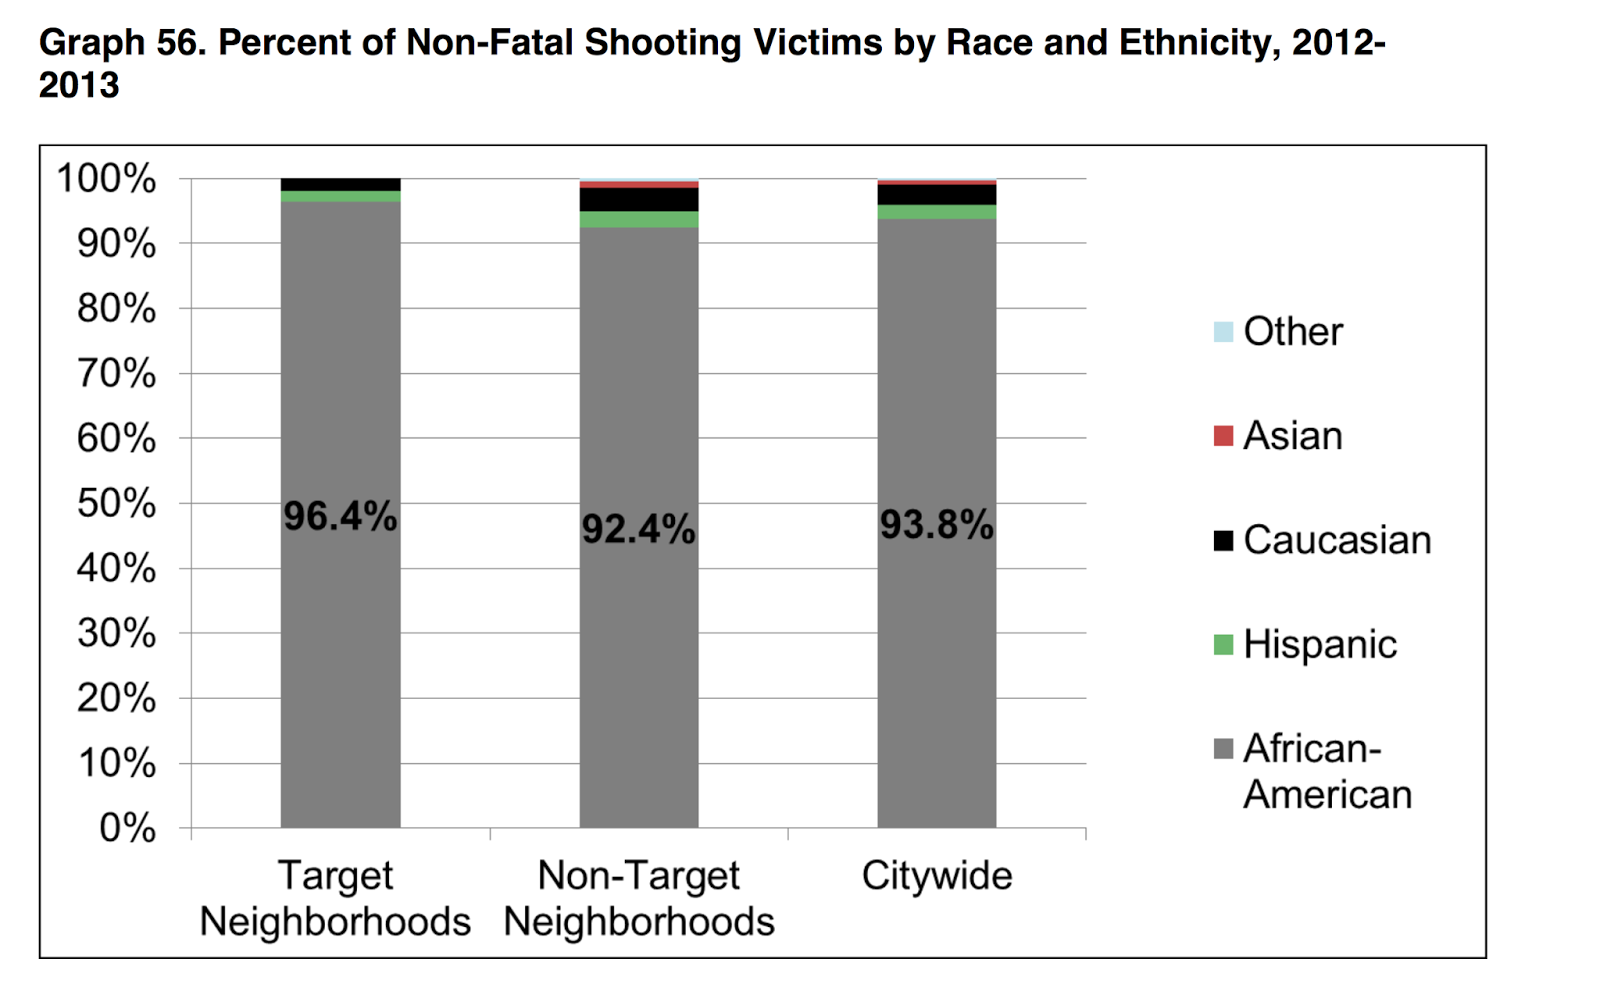
As illustrated in Graph 55 (below), victims were predominantly male (87.9%) and African-American (93.8%; see Graph 56 on page 65). Across all victims, the mean age was 25.5 years (median: 23.0, range: 4-67). Over one-third of victims (37.7%) were under the age of 21, 35.5% were aged 21-29, 26.6% were 30 years of age or older (see Graph 57 on page 65). Two victims’ age remain unknown.
NON-FATAL SHOOTING SUSPECTS (cleared cases through January 6, 2014)

As seen in Graph 62 (page 69), 24.3% of non-fatal shooting cases that occurred during 2012-2013 were cleared as of January 6, 2014 (includes cases cleared by arrest, warrant, or indictment; officer-related shooting; or suicide)5. Almost three-fourths (73.1%) of the cases had no identified suspects as of this date, while 2.6% of cases had an identified suspect who had not yet been charged. In all, 155 unique suspects had been arrested for non-fatal shootings that occurred during 2012-2013 as of January 6, 2014. These arrests cleared 172 non-fatal shooting victims across 116 unique incidents.
Most suspects who were arrested for a 2012-2013 non-fatal shooting were male (90.3%) and African-American (95.5%) (see Graph 63 on page 69 and Graph 64 on page 70). Over two-fifths of the suspects (45.2%) were under the age of 21 and 82.0% were under the age of 30 (median=21.0 years; mean=24.3 years; range: 14-62) (see Graph 65 on page 70). We also examined the age difference of victims and suspects (see Graph 66 on page 71). Half (49.8%) of suspects were younger than their victims, 10.0% were the same age, and 40.3% were older than their victims. On average, suspects were 2.1 years younger than their victim (median: 0.0 years younger; range: -42 to +34 years).
It shouldn’t be hard: when almost all gun violence — homicides and nonfatal shootings, as verified by the mayor of New Orleans strategic command to reduce violence — is committed by blacks, shouldn’t our legislative efforts be to not only disarm blacks, but protect the dwindling white population of NOLA from black violence?
Our missing puzzle piece for violence in present-day New Orleans helps us understand why white southerners long ago passed laws to protect their lives, property and posterity from noticeable levels of black crime/dysfunction then.