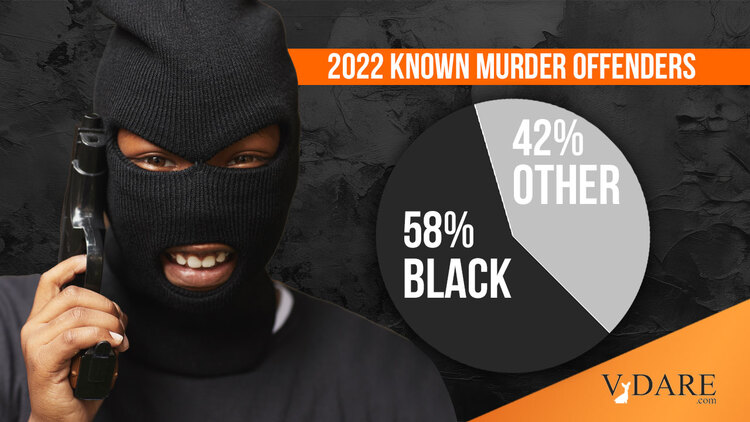
FBI Homicide Data: Blacks Account For ~58% Of Known Murder Offenders In 2022
By Steve Sailer
10/19/2023
The FBI has finally released its Uniform Crime Reporting summary of local police department reports for 2022. Almost exactly as I estimated way back in January, homicides in 2022 were down 6% since their peak in 2021, but still far above the pre–George Floyd year of 2019.
For, literally, decades the FBI has been trying to get all the local police departments in the country to switch from the original methodology for the UCR to a new, slightly better methodology organized around incidents. It’s incredibly boring and appears to be apolitical: cops, both in the FBI and local police departments, are not data nerds and this kind of thing makes their heads hurt so they procrastinate. Last year’s data was particularly sketchy due to a deadline for reporting under the new system that many PDs missed. This year, the FBI promises, the situation is not quite so bad.
But I will still present their data on homicides from two different systems: combined old and new methodology and just the new methodology. The race results are almost identical, with blacks making up around 58% of known murder offenders in both tables.
This is from the FBI’s Expanded Homicide data page, using data from both the new NIBRS methodology and the old one, with about 93% of the country covered:
|
FBI 2022 Murder Offenders |
|||
| Group | Known Murder Offenders | Share of Total (incl Unknown) | Share of Known Murder Offenders |
| Black or African American | 9,627 | 48.7% | 57.6% |
| White or Hispanic | 6,603 | 33.4% | 39.5% |
| American Indian or Alaska Native | 220 | 1.1% | 1.3% |
| Asian | 200 | 1.0% | 1.2% |
| Native Hawaiian | 50 | 0.3% | 0.3% |
| Total Known Offenders Identified by Race | 16,700 | 84.4% | 100.0% |
| Unknown | 3,076 | 15.6% | 18.4% |
| Total Known and Unknown | 19,776 | 100.0% |
And this is from the FBI’s Homicide page, using just the new NIBRS data, or about 75% of the country.
|
National Incident-Based Reporting System (NIBRS) |
|||
| FBI 2022 Murder Offenders | |||
| Group | Known Murder Offenders | Share of Total (incl Unknown) | Share of Known Murder Offenders |
| Black or African American | 8,694 | 52.0% | 58.7% |
| White or Hispanic | 5,738 | 34.3% | 38.7% |
| American Indian or Alaska Native | 233 | 1.4% | 1.6% |
| Asian | 144 | 0.9% | 1.0% |
| Native Hawaiian | 0.0% | 0.0% | |
| Total Known Offenders Identified by Race | 14,809 | 88.5% | 100.0% |
| Unknown | 1,915 | 11.5% | 12.9% |
| Total Known and Unknown | 16,724 | 100.0% |
We can also look at the CDC’s count of homicide victimizations in 2022. These are not perpetration counts, but perpetration and victimization by race tend to go up and down together.
In total, homicides were down 5% from 2021, but were still up 30% from 2019 before George Floyd.
In 2022, black deaths were down 8% from 2021, but up 33% from 2019.
White deaths by homicide were down 4% from 2021, but are still up 16% from 2019.
The big problem in 2022 was that Hispanic deaths were up 1% over 2021, and 44% from 2019. It took Hispanics longer to catch on to the Racial Reckoning than it took blacks, but also longer to begin to get over it.
As a share of total homicide victimizations, black victims accounted for 53.3% in 2022, down from 55.0% in 2021, but up from 55.0% in 2019.
Whites were 24.1% of all victims in 2022, basically the same as 2021’s share of 23.9%, and down from 2019’s 27.0%.
Hispanics were 18.0% of homicide victims in 2022, up from 17.3% in 2021 and up from 16.3% in 2022. Virtually nobody knows that A) Hispanics got relatively less likely to be involved in homicides in the first two decades of this century, but B) relatively more likely to die violently in the 2020s.
