
By Steve Sailer
12/23/2009
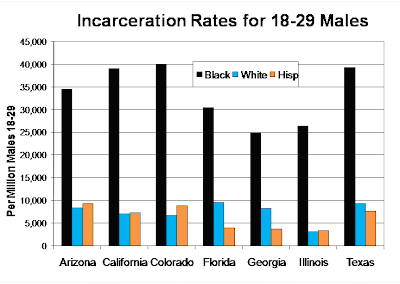
 A friend sends along this graph of incarceration rates for 18-29 year old males for states with sizable mestizo Hispanic populations, pointing out similar incarceration rates for young males for whites and Hispanics. (In Northeastern states where most Hispanics are mulattoes, Hispanics have higher age-adjusted incarceration rates than whites. Unfortunately, I didn’t see a link to a data source in the email.)
He then argues that Hispanic mestizo crime rates are no higher than 15% greater than whites of the same ages.
Is that true?
In many cases, government agencies fail to break out Hispanics as distinct from whites in crime rates. This is a notorious weakness in the national FBI crime rate statistics.
Apparently, the Los Angeles Police Department does, however. A June 10, 2006 LA Times article about a briefing by LAPD chief William Bratton reported:
The numbers reveal a wide racial divide regarding violent crime.
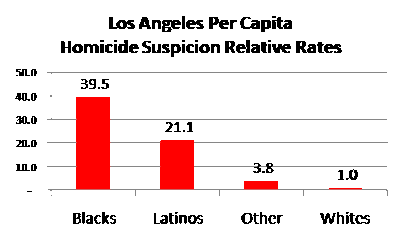
Blacks make up about 11% of the city’s population but account for 38% of all homicide victims and 29% of suspects, according to the statistics. By contrast, whites make up 30% of the population but account for just 6% of homicide victims and 2% of suspects. Latinos make up 47% of the population and constitute 50% of homicide victims and 66% of suspects.
Homicide is hardly the only crime, but it’s a good one to refer to because police departments are more uniformly more serious about recording homicides than about other crimes.
Based on that LA Times report, here’s a graph of per capita homicide suspicion rates in Los Angeles in the middle of this decade:  Can we make sense of these two graphs that seem to paint very different pictures?
I think so, although the lack of official Hispanic crime data remains a problem.
From the point of view of, for instance, the woman I know who was stabbed in the neck and face seven times three years ago by a 19-year-old Latino gang-banger, the fact that she lives in a city with a large number of 19-year-old Latinos increases her chance of getting stabbed. You can’t age-adjust away the risk.
Thus, American Renaissance’s 2005 Color of Crime study of incarceration rates found:
"In total, blacks had the highest incarceration rate at 7.2 times the [nonHispanic] white rate, followed by Hispanics, at 2.9 times the white rate. [American] Indians and Pacific Islanders were imprisoned at about twice the white rate, and Asians at only 22 percent of the white rate."
Consider, for example, how often the Mainstream Media tells us that illegal immigration from Latin America is good for American citizens because it is lowering the average age and thus injecting vibrancy into the economy. Perhaps, but if the upside of Hispanic youthfulness is constantly touted, it would seem reasonable to also point out its downside in terms of increased crime.
Another adjustment that’s going on in the top graph is adjusting away the relatively high ratio of young adult male to female Latinos in the U.S. The rigors of illegal immigration mean there are more male than female illegal immigrants in the country. And males commit more crimes, so let’s adjust the sex difference away by comparing Latino males to white males. After all, it’s not fair that Latinos commit more crimes per capita because they have a high male to female ratio.
But that’s cold comfort to the crime victims.
- Crucially, Latinos who immigrated at age 18 and up probably have quite low violent crime rates (other than drunken vehicular manslaughter and drunken fights), while American-born Latinos seem to have fairly high crime rates. So, lumping immigrant and American-born Hispanics together as the first graph does blurs the long run implications of immigration.
The American-born to immigrant incarceration ratios are often said to five, even eight times higher.
Here’s a chart recently made by Jason Richwine using Census Bureau data from about a decade ago:
The white bars are American-born whites, the green bars are Hispanic immigrants, and the orange bars are American-born Hispanics. The key grouping is the second: "Young Men Institutionalized." ("Institutionalized" more or less means "imprisoned" when it comes to young men.) The Hispanic immigrant institutionalization rate is only about half that of the white native rate, but the white native rate is only about 40% of the institutionalization rate of the Hispanic native.
Still, I’m sure there is a sizable difference. In general, guys who immigrated as adults in order to get work aren’t criminal types. The criminally inclined tend to be homeboys who never fully outgrow their juvenile gang phase and juvenile gang friends.
The problem, of course, is that in a situation in which the incarceration rate for immigrant Latinos is only 1/8th that of American-born Latinos, the immigrants then have sons.
Similarly, Linda Chavez wrote in 2006:
Before bashing immigrants, at least try to get the facts straight By Linda Chavez
University of California professor Ruben Rumbaut, an expert on immigration and crime, looked at 2000 Census data on the institutionalized population in the United States, most of whom are in prisons, and came up with these astonishing facts. Immigrants are far less likely to be in jail or prison than other U.S. residents.
Of the U.S. population of 45.2 million men ages 18 to 39 (those most likely to be in the criminal population), 3 percent were incarcerated, or about 1.3 million at the time of the 2000 Census. But of these, blacks, whites and U.S.-born Hispanics had incarceration rates that dwarfed those of immigrants. Only .7 percent of Mexican-born males were in prison or jail, compared with 3.51 percent of all U.S.-born males, which includes 1.71 percent of non-Hispanic whites, 11.6 percent of blacks and 5.9 percent of Mexican Americans.
I suspect this ratio (5.9% to 0.7%) is exaggerated due to immigrants lying to avoid deportation. Steve Camarota wrote a good report recently on how you really can’t trust the various numbers tossed around.
That would suggest that Richwine’s ratio in the graph above of a roughly 2.5X higher institutionalization rate for American-born Hispanic young men compared to American-born white young men is somewhat exaggerated by incarcerated immigrant Hispanics claiming to be American-born to avoid deportation.
So, I would guess there is somewhere around, or a little lower than, a 2X ratio in age-adjusted crime rates between American-born Hispanics and American-born whites. That’s a very rough guess because of the poor quality of the government data on Hispanic crime rates, and the lack of academic enthusiasm for tackling this subject. But, the comparison of American-born Hispanics to American-born whites seems to me to be the relevant one for assessing the long-term import of immigration. The national average ratio is likely not as extreme as the Los Angeles one, but it’s very likely higher than a naive glance at the first graph above would suggest.
So, this would suggest that the null hypothesis that the per capita age-adjusted crime rates of the two groups of American-born young men are the same is unlikely.
Trying to find some good news in all this, here’s a novel idea. Perhaps the rise of organized crime to its current apocalyptic heights in Mexico means that recent Mexican immigrants were better selected for resistance to law-breaking than previous ones. After all, a poor young man born in Mexico in the early 1980s had to lucrative options 21 years later: go to America and work construction during the Housing Bubble or go to work for a drug cartel in Mexico. So, maybe we got the good ones out of that generation. And maybe they'll transmit their law-abidingness to their sons.
It could happen.