By Steve Sailer
07/10/2010
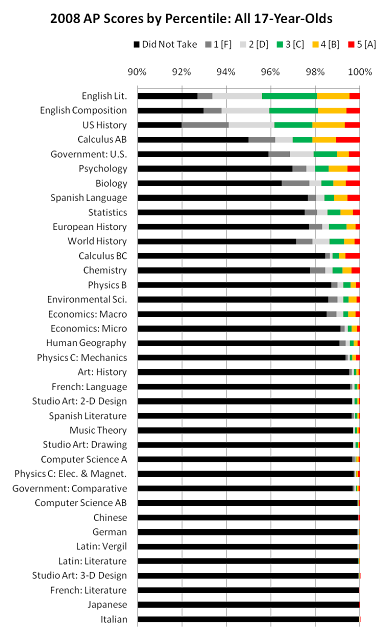
AP tests are graded 1 to 5 with a 5 supposed to be an equivalent to an A in a typical college’s introductory year long course in the subject, a 4 equal to a B, and so forth.
So, if your kid took the English Lit test (the top bar in the graph) and got a 4 (the yellow-orange band), he actually scored at the 98th percentile (or higher) out of all kids his age in the country. If he got a 3 (light gray) in US History the third bar down), he scored in at least the 94th percentile.
Of course, if all students took the test, the number of people scoring 3s, 4s and even 5s would go up. In particular, Red State students don’t take APs as much as Blue State students, and whites don’t take anywhere near as many APs as Asians.
My 2009 VDARE.com article has lots of graphs on how students do on the AP, overall and by race.
This is a content archive of VDARE.com, which Letitia James forced off of the Internet using lawfare.