Illegal Crossings Fell In January
02/11/2018
The latest figures from the Southwest Border show crossings falling, not rising:
| USBP | Demographic | OCT | NOV | DEC | JAN | Total |
|---|---|---|---|---|---|---|
| Southwest Border | UAC | 3,158 | 3,981 | 4,078 | 3,227 | 14,444 |
| Family Units | 4,837 | 7,015 | 8,120 | 5,656 | 25,628 | |
| Southwest Border Total Apprehensions | 25,487 | 29,080 | 28,997 | 25,980 | 109,544 | |
Southwest Border Migration FY2018During the month of January, CBP saw a 12 percent decrease in individuals apprehended while trying to enter the country illegally in between established ports of entry, and in those presenting themselves for entry, without proper documentation, along our Southwest border. This is typical of the migration patterns in the month of January. [More]
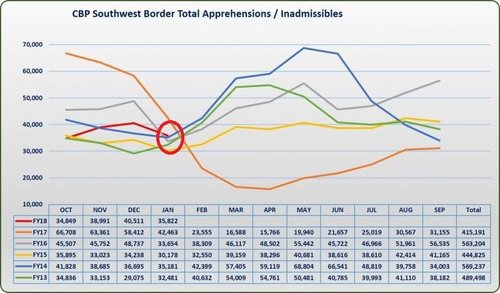
This chart covers several years, I've circled the dip in this January: 
The January figures aren’t the big story, just the most recent. The real story is the orange line, for Fiscal Year 2017, "Fiscal Year" starting in October 2016. That shows a massive drop, and that’s the Trump Effect.
