

By Steve Sailer
07/21/2023
An interesting question is whether there are regional differences in African-American culture the way there are, famously, regional differences in white American culture, most famously exemplified in David Hackett Fischer’s Albion’s Seed. I recently reviewed Fischer’s African Founders in the hope that he’d discovered similar regional patterns among black Americans. But the great man was pretty much stumped by the question.
My guess is that African-Americans tended to be fairly blended by nature and nurture.
Yet there are huge regional differences among African-Americans in important measures such as the homicide victimization (not perpetration, but it is likely highly correlated) rate. For example, in 2020-2022, the CDC reports that black males aged 15-24 died by firearm homicide about 4 to 6 times as much per capita in Missouri (home of the Ferguson Effect), liberal Washington D.C., Illinois, and Louisiana as in Massachusetts, New York, New Jersey, or West Virginia.
I focused on young males as most likely to be influenced by culture.

I’m not seeing much of a pattern here. Instead, this seems to reflect idiosyncratic patterns. For instance, Fischer notes that Louisiana has been highly homicidal for the last three centuries, but what that has to do with the District of Columbia, I don’t know.
| State | Black Rate | White Rate | B to W Ratio |
| Missouri | 239.1 | 6.0 | 40 |
| District of Columbia | 233.4 | ||
| Illinois | 203.1 | 2.6 | 78 |
| Louisiana | 198.2 | 6.5 | 30 |
| Indiana | 194.3 | 7.3 | 27 |
| Pennsylvania | 178.6 | 2.8 | 64 |
| Arkansas | 175.8 | 7.8 | 23 |
| Wisconsin | 174.0 | 2.0 | 89 |
| Kentucky | 168.4 | 7.0 | 24 |
| Tennessee | 165.8 | 5.2 | 32 |
| Ohio | 162.7 | 4.8 | 34 |
| Alabama | 158.3 | 6.5 | 24 |
| Mississippi | 149.8 | 9.9 | 15 |
| Oregon | 139.2 | 4.2 | 33 |
| South Carolina | 137.8 | 5.3 | 26 |
| Michigan | 125.9 | 2.9 | 43 |
| Delaware | 122.7 | ||
| Maryland | 114.7 | 4.6 | 25 |
| Iowa | 110.1 | ||
| North Carolina | 105.8 | 5.6 | 19 |
| Virginia | 101.5 | 3.3 | 31 |
| Nebraska | 98.0 | 3.7 | 26 |
| Georgia | 95.6 | 6.1 | 16 |
| Kansas | 93.0 | 4.6 | 20 |
| Colorado | 92.6 | 4.4 | 21 |
| Arizona | 91.6 | 5.5 | 17 |
| Oklahoma | 90.6 | 6.7 | 14 |
| Texas | 89.1 | 7.7 | 12 |
| Florida | 89.0 | 5.0 | 18 |
| Minnesota | 88.1 | 1.5 | 57 |
| California | 85.0 | 3.9 | 22 |
| Nevada | 80.8 | 6.5 | 12 |
| Connecticut | 73.7 | ||
| Washington | 72.7 | 3.9 | 19 |
| West Virginia | 65.4 | 5.1 | 13 |
| New Jersey | 58.4 | 1.2 | 49 |
| New York | 58.3 | 1.3 | 45 |
| Massachusetts | 44.9 | ||
| Alaska | |||
| Hawaii | |||
| Idaho | |||
| Maine | |||
| Montana | 6.2 | ||
| New Hampshire | |||
| New Mexico | 12.5 | ||
| North Dakota | |||
| Rhode Island | |||
| South Dakota | |||
| Utah | 2.6 | ||
| Vermont | |||
| Wyoming | |||
| Total | 119.7 | 4.3 | 28 |
For privacy reasons, the CDC doesn’t list homicides in states with fewer than 10 in 2020-2022. For example, I’m not sure if a young white man has been murdered with a gun in D.C. since Seth Rich in 2016.
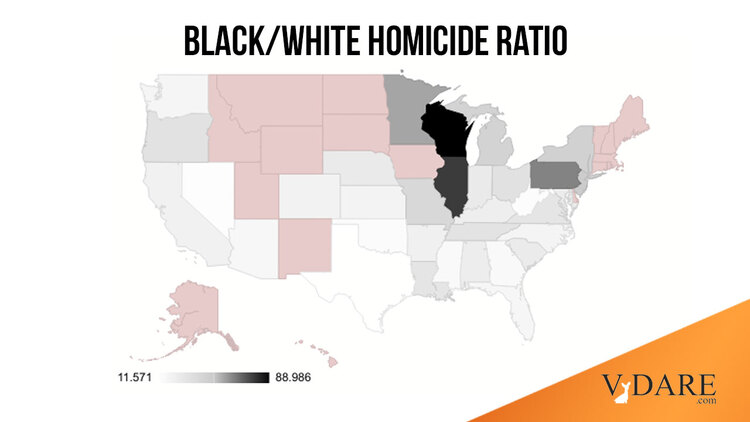
Here’s the white rate mapped, with pinkish being not enough data:

The worst black to white ratio of homicide over the last 3 years is in Wisconsin, where young black men, age 15-24, were 89 times as likely to die by homicide as white men of the same age. The second biggest gap was in Illinois at 78x. The narrowest gaps were in Nevada and Texas (12x) and West Virginia (13x).
