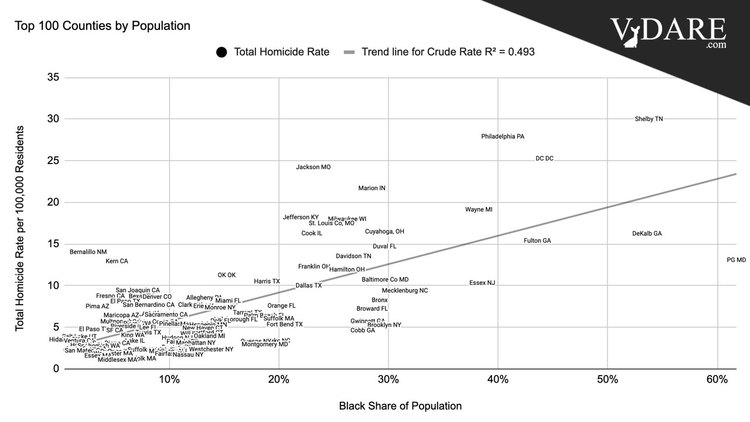
Top 100 Counties By Homicide Rate Vs. Black Share Of The Population
11/03/2022

Following up on my new Taki’s Magazine column on “The Floyd Effect,” here are the top 100 counties in the U.S. by population, with the total homicide rate (2018-2021) on the vertical axis and the black share of the population on the horizontal axis.
The correlation coefficient r is just over 0.7. Counties above the best-fit line tend to have major urban centers, such as Shelby County, Tennessee (Memphis) and Jackson MO (Kansas City). As I’ve been pointing out, the worst black homicide rates in recent years tend to be near the vast Mississippi watershed, both north and south.
The homicide rates in Philadelphia County and the District of Columbia are a disgrace compared to New York or Boston homicide rates. Washington DC has a huge number of armed men guarding federal offices and such highbrow whites that the white part of D.C. is so safe that the CDC won’t tell you for personal privacy reasons how many whites died by homicide over those four years, just that it was less than ten. Seth Rich wasn’t the last white murder victim in D.C., but he’s close.
The worst homicide rate for a county with few blacks is Bernalillo, NM (Albuquerque) followed by Kern, CA (Bakersfield).
Most of the counties below the line are suburban, such as heavily black Prince George’s County, MD outside of Washington DC. Exceptions include Kings, NY (Brooklyn), Bronx, NY (both of which benefit from NYC’s very low shooting rate in this century), and Fulton, GA (Atlanta). Atlanta isn’t great, but it has traditionally had an intelligent black political class that wants to hang on to its white corporate tax cows. Hence, Atlanta has become the center of buppie culture in America.
Note that above-the-line St. Louis County represents St. Louis’s suburbs, such as Ferguson, while slightly below-the-line Baltimore County is Baltimore’s suburbs. St. Louis City and Baltimore City would be off the charts if they ranked in the top 100 counties by population.
