Why Did Overdoses Soar The Month After COVID Stimulus Checks?
04/15/2023
Actuary Mary Pat Campbell has been giving talks on causes of death trends in this decade to actuary clubs, such as the important one in Hartford:
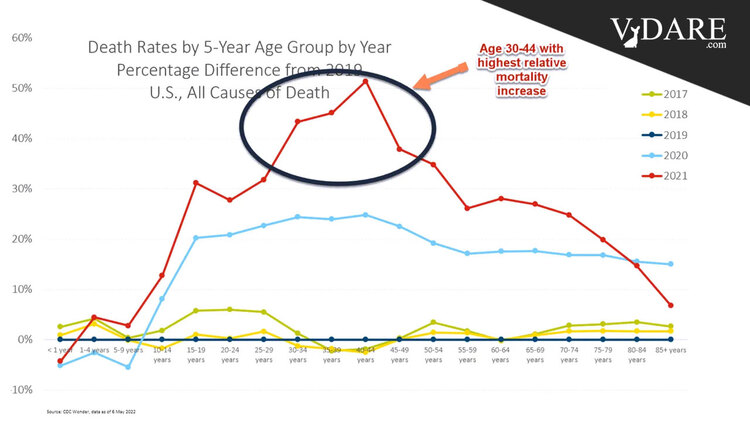
Big result: worst excess mortality for ages 30-44

For 2021, the worst relative increase in mortality, compared to 2019, was for ages 30-44.
[I have called it the Millennial Massacre, but it obviously overlaps with Gen X… and Middle Age Massacre doesn’t exactly work, either. Dang the allure of alliteration].
We will see in a moment that most of that mortality increase didn’t come from COVID.
If you look at overall mortality, obviously total mortality for this age group is much lower than for those much older.
A 5% increase in mortality for those aged 85+ will translate to a much larger number of deaths, but a 50% increase in mortality for those aged 40-44 is extremely worrisome to actuaries and insurers even if the absolute number of deaths is lower in impact. We’re setting reserves and expectations based on certain assumptions, and we’re generally not assuming fluctuations of 50% — that’s just nuts compared to our historical experience…
…until now.
The big question: how much of the excess mortality was COVID?
A second key graph:

For those age 85+, more than 100% of the excess mortality is explained by COVID for 2021 — there really is nothing to explain beyond COVID. Small kids really didn’t have excess mortality, so there’s nothing to explain there.
For older middle-aged adults, age 45-84, the majority of the excess is COVID. There still is a non-COVID component to explain, but it’s not the majority.
However, the part we really are worried about, age 10-44, and that age 30-44 in particular, less than half of that excess mortality was COVID. We need to dig into that if we’re to get a handle on mortality projections as actuaries.

Actuary Mary Pat Campbell did a presentation recently on increases in death rates. You can divide them up into Natural (cancer, heart attacks, etc.), COVID, and External or Investigation (homicides, car crashes, ODs, suicides, falls, etc. — deaths that demand some investigation). External deaths shot upwards 18% from April 2020 to July 2020 when America went nuts over George Floyd and then got worse in 2021 before moderating only slightly in the summer of 2022.
Mary Pat depicts 2020 (blue) and 2021 (red) relative to the good old days of 2019.
Suicide rates in this decade dropped for middle-aged people (one of Case and Deaton’s “deaths of despair“), but grew for the elderly (perhaps widowers who’d lost a spouse to COVID?) and, alarmingly, for the young, especially in 2021.

According to my CDC WONDER data, suicides among whites age 15-44 in 2021 were up 2% over 2019 and down -5% among whites 45 and over. But suicides among 15-44 year olds were up 25% among blacks, 14% among Hispanics, and 8% among Asians.

I don’t know why that is, but it’s worth noting that for yet another cause of death, not just homicides, traffic fatalities, and overdoses, that the second coming of Black Lives Matter after May 25, 2020 appears to have coincided with a disastrous increase in black death rates.
The homicide graphs won’t surprise my readers:

The light blue-green line for 2022 is only through September 2022, so ignore it. The CDC WONDER data for certain external causes of death like homicide and suicide comes with a six-month lag to let the coroner make up his mind. My guess is from looking at big city homicide counts for 2022 back around New Year’s Day that 2022 will see somewhere around a 5% decline in dead bodies back down to the 2020 level, which was 30% higher than 2019.

And there are traffic fatalities, which soared in 2020 and again in 2021:

Drug overdoses soared in 2020 and again in 2021 (ignore 2022).

Presumably this is due to fentanyl killing recreational drug users as well as hard-core deaths of despair. Perhaps COVID stimulus checks tended to get spent on fentanyl-laced cocaine and meth?
You can divide this century’s drug overdose deaths up roughly into three eras:
- 2000-2009: The Oxycodone Era — mostly depressed white working class in the middle of the country
- 2010-2015: Mexican Black Tar Heroin — after the government cracked down on painkiller pill prescriptions, the cartels moved in, but aimed at similar demographics
- 2016-?: Fentanyl — all demographics, including black inner cities that the cartels had intentionally avoided in the heroin era. Overdoses are now killing younger people who aren’t Deaths of Despair, they just wanted to party.

Good Friday: St. Matthew Passion and Data Updatehttps://t.co/hgsJarSaez
And just jumping to the bottom line — here’s a hideous graph on drug overdose deaths in the U.S. through the pandemic
pre-pandemic, the avg deaths/day from ODs was about 160
spiked to 280 in May 2020 pic.twitter.com/5Jsl4oLbzG
— Mary Pat Campbell (@meepbobeep) April 7, 2023
The first COVID stimulus checks went out in March-April 2020. It looks like the combination of lockdown boredom and $1200 of free cash got a lot of people dead a few weeks later. A $600 check went out in December 2020, which led to a moderate spike in ODs in January 2021, and a $1400 check in March 2021, which led to the peak of 291 OD deaths per day in April 2021.
