National Data | August Jobs: Native-born Lose, Immigrant Workers Take All — And Illegal Infiltration Surges. Legislation Essential.
09/12/2018
It is now clear that a quiet crisis is developing on the Southwest border. A September 12 Department of Homeland Security statement notes that, while the August jump in apprehensions was “consistent with an expected seasonal increase” — itself disappointing after President Trump’s election seemed to have broken the pattern — the sharp increase in family units was “a clear indicator that the migration flows are responding to gaps in our nation’s legal framework” a.ka. judicial sabotage. Moreover, the recently-released jobs data revealed that August was not kind to native-born job seekers. The unavoidable conclusion: administrative remedies and jawboning — what we have called the “Trump Effect” — can only slow, not reverse, America’s immigration disaster. Ultimately, legislation is essential.
The Household Employment Survey, which unlike the more commonly cited Payroll Survey records the nativity of respondents, reports a total job decline of 423,000 in August. This, of course, is a jarring departure from general Payroll Survey euphoria — it reported job growth of 201,000 — and calls into question the notion that incessant efforts to thwart Trump’s power have not diminished our economic mojo.
In August:
- Immigrant employment rose by 347,000 — up by 1.3%
- Native-born American employment fell 770,000, down by 0.6%.
- The immigrant employment index, set to 100.0 in January 2009, rose to 125.2 from 123.6 in July.
- The native-born American employment index fell to 105.5 from 107.2 in July
- The New VDARE American Worker Displacement Index (NVDAWDI), our term for the ratio of immigrant to native-born employment growth indexes, rose to 117.5 from 115.4 in July. The all-time displacement high, 123.0, was set in April.
Before August, native-born American workers had been enjoying a three-month recovery from the disastrous January-April reversal of the Trump Effect. In May, June, and July all job growth went to native-born American workers. Their July job gain — 606,000 — was more than 5 times larger than their 114,000 gain in June, though less than half the 1.361 million gain in native-born American employment recorded in May. Immigrants lost jobs in each of these months.
Three good months do not a trend make. Neither does one bad month: we expect the Trump Effect to reassert itself in coming months.
But Trump has not yet even begun to repair the damage done by eight years of Obama. Native-born American workers lost ground to their foreign-born competitors throughout the Obama years. And, as seen in the chart above, this trend accelerated significantly in the months leading up to the 2016 election.
Trump supporters have reason to be restless: Since taking office in January 2017 President Trump has presided over a labor market in which immigrants have gained 1.124 million jobs, a 4.3% increase, while native-born Americans gained 2.3 million jobs — a rise of 1.9%. As far as the labor market is concerned, “America First” has not yet translated into Americans First.
Another troubling sign: after growing by less than 1 million in June and July, the immigrant workforce population rose by 1.065 million in August (year-over-year). As recently as April the influx was at 2.2 million, so the short-term trend is still favorable. However, immigrant workforce growth is still high in absolute terms: in contrast, it actually shrank in the last five months of 2017 when the Trump Effect seemed to be really taking hold.
These are net figures. Over a 12-month period an average of perhaps 300,000 immigrants die and an equal number leave the U.S. voluntarily. So August’s 1.065 million net rise (year-over-year) in foreign-born population implies that about 1.665 million foreign-born individuals may have actually settled in the country over those 12 months. (This excludes tourists and other short-term entrants.)
Another way of looking at American worker displacement: the immigrant share of total U.S. employment:
Immigrants accounted for 17.4% of total employment in August. While below the all-time high of 18.1% recorded in April, the August figure is ninth highest among the 116 months for which we have data.
A detailed snapshot of American worker displacement over the past year is available in the Employment Status of the Civilian Population by Nativity table published in the monthly BLS Report.
|
Employment Status by Nativity, Aug. 2017-Aug. 2018 |
||||
|
(numbers in 1000s; not seasonally adjusted) |
||||
|
Aug-17 |
Aug-18 |
Change |
% Change |
|
|
Foreign born, 16 years and older |
||||
|
Civilian population |
41,630 |
42,695 |
1,065 |
2.56% |
|
Civilian labor force |
27,673 |
28,053 |
380 |
1.37% |
|
Participation rate (%) |
66.5 |
65.7 |
-0.1 pts. |
-1.20% |
|
Employed |
26,520 |
27,110 |
590 |
2.22% |
|
Employment/population % |
63.7 |
63.5 |
-0.2 pts. |
-0.31% |
|
Unemployed |
1,153 |
943 |
-210 |
-18.21% |
|
Unemployment rate (%) |
4.2 |
3.4 |
-0.8 pts. |
-19.05% |
|
Not in labor force |
13,957 |
14,642 |
685 |
4.91% |
|
Native born, 16 years and older |
||||
|
Civilian population |
213,726 |
215,371 |
1,645 |
0.77% |
|
Civilian labor force |
133,190 |
133,856 |
666 |
0.50% |
|
Participation rate (%) |
62.3 |
62.2 |
-0.1 pts. |
-0.16% |
|
Employed |
127,056 |
128,429 |
1,373 |
1.08% |
|
Employment/population % |
59.4 |
59.6 |
0.2 pts. |
0.34% |
|
Unemployed |
6,134 |
5,427 |
-707 |
-11.53% |
|
Unemployment rate (%) |
4.6 |
4.1 |
-0.5 pts. |
-10.87% |
|
Not in labor force |
80,536 |
81,515 |
979 |
1.22% |
|
Source: BLS, The Employment Situation-August 2018, Table A-7, September 7, 2018. PDF |
||||
Over the past 12 months (August 2017 to August 2018):
- The immigrant labor force (employed plus looking for work) rose by 1.37%; the native-born labor force grew by 0.50%. ADVANTAGE IMMIGRANTS, though their advantage has narrowed dramatically since April when the immigrant labor force grew 7 times faster.
- The Labor Force Participation Rate, a sign of worker confidence and mobility, fell by 0.1 points for both immigrants and native-born Americans. This marks the end of a four-month period in which native-born LPRs rose, year-over-year, relative to those of immigrants. ADVANTAGE IMMIGRANTS
- Immigrant employment grew 2.22%; native-born American employment by 1.08%. ADVANTAGE IMMIGRANTS, though much reduced from the multiples we saw earlier this year
- The unemployment rate for immigrants fell to 3.4%, a whopping 19.1% decline from July 2017; the unemployment rate for native-born workers fell by 11%, but remains well above that of immigrants. A big win for immigrants, who enjoyed both lower and more rapidly declining unemployment rates over this period — possibly a reflection of their superior mobility.
- The number of native-born unemployed fell by 707,000 — an 11.5% drop; immigrant unemployment fell by 210,000 — a 19% reduction. ADVANTAGE IMMIGRANTS
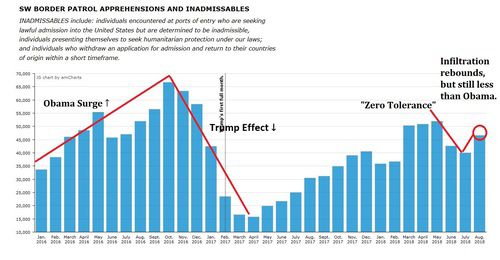
The renewed illegal alien surge that began last year seemed to be abating. Border Patrol apprehensions peaked at 51,905 in May 2018, then fell to 42,838 in June, and 39,953 in July. But in August they rebounded to 46,560. The good news: this is still below Obama’s catastrophic last years. The bad news: it’s clear that the collapse in the early months of Trump’s presidency was temporary.
Over the long haul, only legislation, including a border wall to stop the illegal alien flow; a second Operation Wetback and E-Verify, to get the illegal alien self-deporting; and above all, a moratorium on legal immigration, can secure the fruits of the current economic expansion for Americans.
Edwin S. Rubenstein is President of ESR Research Economic Consultants.