08/05/2018
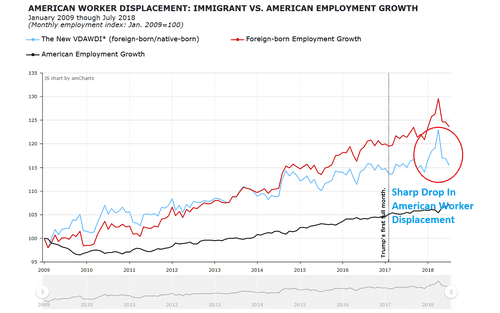
The “Trump Effect” seems to be creeping back. For the third straight month, the just-released July jobs data shows that the shocking surge in immigrant displacement of American workers and in the immigrant workforce, which began in January and completely undid the improvement in American worker protection we had begun hopefully to call the “Trump Effect,” continues to ebb. And apprehensions on the southwestern border fell through June, the latest available month available, suggesting that illegal immigration is also receding after rebounding this spring, possibly a vindication of the Trump Administration’s heroic struggle to implement “zero tolerance” toward illegal “infiltrators” (the useful Israeli term).
For the third consecutive month, all job growth went to native-born American workers. Their July job gain — 606,000 — is more than 5 times larger than June’s 114,000 gain, though less than half the 1.361 million gain in native-born employment recorded in May. Immigrants (legal and illegal, federal data does not distinguish) lost jobs in each of these months.
Equally important: the immigrant working-age population was just 827,000 higher this July than the previous July, as opposed to a year-over-year gain of 962,000 in May. The immigrant workforce had been growing by over 1 million year-over-year since January, peaking at an appalling 2.2 million in April. So this too is an improving trend, although still not back to the success of Trump’s first year: the immigrant workforce actually shrank in the last five months of 2017.
This pattern of sudden deterioration in American worker protection followed by steady recovery was also seen in 2017. But whereas 2017’s overall improvement must mostly be attributed to the “jawboning” effect of Trump’s election, there are now numerous executive actions, including the sharp reduction in the refugee intake, to which Trump can point. However, these can only have marginal, and easily-swamped, effect. Only legislation — a border wall to stop the illegal alien flow; a second Operation Wetback, including E-Verify, to get the illegal alien stock self-deporting; above all a moratorium on legal immigration — can secure the fruits of the current economic expansion for American workers.
In July:
Of course, Trump has not yet even begun to repair the damage done by eight years of Obama. Native-born American workers lost ground to their foreign-born competitors throughout the Obama years.
Overall, since taking office in January 2017 President Trump has presided over a labor market in which immigrants have gained 777,000 jobs, a 3.0% increase, while native-born Americans gained about 3.1 million jobs — a rise of 2.5%. As far as the labor market is concerned, “America First” has not yet translated into Americans First. But at least we’re again headed in the right direction.
As noted above, July 2018 brought (relatively) good news on the population front. In July, there were 827,000 more working-age immigrants than in July 2017. This comes on the heels of a 962,000 gain in June, and gains of 1.342 million and 1.597 million, year-over-year, in May and April respectively.
In percentage terms, however, native-born Americans are still losing ground. The native-born working-age population rose 0.9%, year-over-year, in July while the immigrant population rose by 2.0%. But July’s immigrant population growth rate was the smallest for any month this year, possibly signaling the returning “Trump effect.”
These are net figures. Over a 12-month period an average of perhaps 300,000 immigrants die and an equal number leave the U.S. voluntarily. So July’s 827,000 million net rise (year-over-year) in foreign-born population implies that about 1. million foreign-born individuals may have actually settled in the country over those 12 months. (This excludes tourists and other short-term entrants.)
Another way of looking at American worker displacement: the immigrant share of total U.S. employment:
Immigrants accounted for 17.2% of total employment in July. Note that, while significantly below the all-time high of 18.1% recorded in April, the July figure is eighth highest among the 115 months for which we have data. But it is almost back to the 17.09% recorded in January 2017, the month of Trump’s Inauguration, when the news of his election had already had a chilling effect.
A detailed snapshot of American worker displacement over the past year is available in the Employment Status of the Civilian Population by Nativity table published in the monthly BLS Report.
|
Employment Status by Nativity, July 2017-July 2018 |
||||
|
(numbers in 1000s; not seasonally adjusted) |
||||
|
Jul-17 |
Jul-18 |
Change |
% Change |
|
|
Foreign born, 16 years and older |
||||
|
Civilian population |
41,452 |
42,279 |
827 |
2.00% |
|
Civilian labor force |
27,536 |
27,858 |
322 |
1.17% |
|
Participation rate (%) |
66.4 |
65.9 |
-0.5 pts.. |
-0.75% |
|
Employed |
26,438 |
26,942 |
504 |
1.91% |
|
Employment/population % |
63.8 |
63.7 |
-0.1 pts. |
-0.16% |
|
Unemployed |
1,098 |
916 |
-182 |
-16.58% |
|
Unemployment rate (%) |
4.0 |
3.3 |
-0.7 pts. |
-17.50% |
|
Not in labor force |
13,916 |
14,420 |
504 |
3.62% |
|
Native born, 16 years and older |
||||
|
Civilian population |
213,699 |
215,564 |
1,865 |
0.87% |
|
Civilian labor force |
134,375 |
135,876 |
1,501 |
1.12% |
|
Participation rate (%) |
62.9 |
63.0 |
0.1 pts. |
0.16% |
|
Employed |
128,033 |
130,062 |
2,029 |
1.58% |
|
Employment/population % |
59.9 |
60.3 |
0.4 pts. |
0.67% |
|
Unemployed |
6,342 |
5,814 |
-528 |
-8.33% |
|
Unemployment rate (%) |
4.7 |
4.3 |
-0.4 pts. |
-8.51% |
|
Not in labor force |
79,324 |
79,688 |
364 |
0.46% |
|
Source: BLS, The Employment Situation-July 2018, Table A-7, August 3, 2018. PDF |
||||
Over the past 12 months (July 2017 to July 2018):
Edwin S. Rubenstein is President of ESR Research Economic Consultants.