12/05/2014
A Blockbuster. A knockout. “According to BLS, the job gains were universal.” Mainstream economists gushed shamelessly over the apparent good news contained in the latest jobs report. [Economists wowed by strong payrolls number By Robert Schroeder, CBS MarketWatch, December 5, 2014]President Obama has been giddily boasting about the raw job numbers, saying, among other things that “[O]verall, wages are rising — a very welcome sign for millions of Americans.”[Remarks by the President in Nominating Ashton Carter as Secretary of Defense December 05, 2014]
At first glance the headline numbers seem to support them: The U.S. added 321,000 new jobs in November, the biggest gain in business payrolls in nearly three years. Unemployment held steady at 5.8%, a six year low. Virtually every industry added employees, and many of the new jobs were in fields that pay well.
But there are nagging problems. At this stage of previous recoveries, wages were growing rapidly. In 2014, despite robust job growth, hourly wages remain stuck in a rut. Wages are only up 2.1% in the past 12 months, a rate that’s barely changed since the recovery began in mid-2009.
Some economists say the slow growth in wages reflects a broader shift to lower-paying jobs. We say, au contraire, it’s not low wage jobs, but the increased availability of low-wage immigrant labor that is suppressing wage growth in this country.
Exhibit one: the November Household Employment Survey.
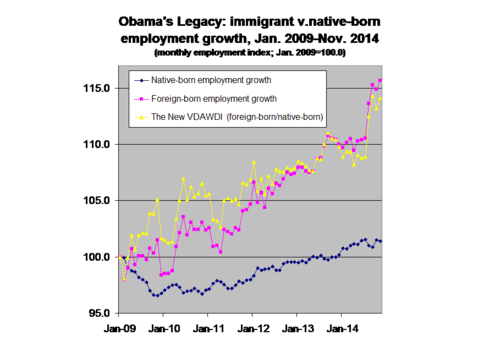
Total employment rose a mere 4,000 according the Household Survey, a figure totally out of sync with the 300,000+ growth reported by the survey of business establishments. But behind the miniscule gain in total Household employment is a significant acceleration of two trends we have often noted. Immigrants are gaining ground, while native-born Americans are losing.
In November:
Native-born American employment growth is the black line, immigrant employment growth is in pink, and NVAWDI — the ratio of immigrant to native-born American job growth — is in yellow. The index starts at 100.0 for both immigrants and native-born Americans in January 2009, and tracks their employment growth since then.
From January 2009 to November 2014:
The immigrant share of total employment has risen steadily, albeit erratically, since the start of the Obama years. Over the past four months, however, what had been a glacial trend turned torrential:
In November the immigrant share of total employment was 17.00%, the second-highest recorded during the Obama years. (It was up from October’s 16.89%, but slightly below the record set in September, 17.03%.)
With total employment running at about 147 million, every one percentage point gain in employment share translates to 1.47 million more workers. From February 2009 to November 2014 the immigrant share of total employment rose from 14.97% to 17.00% — a gain of 2.03 percentage points.
Implication: Since the start of the Obama Administration as many as 2.98 million (2.03 times 1.47 million) native-born Americans may have lost jobs due to immigration.
A detailed snapshot of American worker displacement over the past year is seen in Household Survey data published in the monthly job report:
| Employment Status by Nativity, Nov. 2013- Nov. 2014(numbers in 1000s; not seasonally adjusted) | ||||
| Nov-13 | Nov-14 | Change | % Change | |
| Foreign-born, 16 years and older | ||||
| Civilian population | 38,737 | 40,027 | 1,290 | 3.3% |
| Civilian labor force | 25,579 | 26,536 | 957 | 3.7% |
| Labor force participation rate (%) | 66.0% | 66.3% | 0.3% | 0.5% |
| Employed | 23,961 | 25,108 | 1,147 | 4.8% |
| Employment/population % | 61.9% | 62.7% | 0.8% | 1.3% |
| Unemployed | 1,618 | 1,428 | -190 | -11.7% |
| Unemployment rate (%) | 6.3% | 5.4% | -0.9% | -14.3% |
| Not in labor force | 13,158 | 13,491 | 333 | 2.5% |
| Native-born, 16 years and older | ||||
| Civilian population | 207,830 | 208,817 | 987 | 0.5% |
| Civilian labor force | 129,467 | 129,760 | 293 | 0.2% |
| Labor force participation rate (%) | 62.3% | 62.1% | -0.2% | -0.3% |
| Employed | 120,814 | 122,558 | 1,744 | 1.4% |
| Employment/population % | 58.1% | 58.7% | 0.6% | 1.0% |
| Unemployed | 8,653 | 7,202 | -1,451 | -16.8% |
| Unemployment rate (%) | 6.7% | 5.6% | -1.1% | -16.4% |
| Not in labor force | 78,363 | 79,056 | 693 | 0.9% |
| Source: BLS, The Employment Situation — November 2014,Table A-7, December 5, 2014. PDF | ||||
Two points are worth making. First, should these growth rates persist, the foreign-born population of working-age will double in about 22 years. It will take a whopping 144 years for the native-born population to match that. By then, of course, immigrants will dominate the U.S. workforce.
Secondly, the increase in the foreign-born working-age population over the past year (1.29 million) exceeds the number of legal immigrants admitted annually, which has been running at about 1 million. Obvious implication: A strong U.S. job market is drawing illegals into country. Contra President Obama, the news is not a “very welcome sign for millions of Americans”, but a “very welcome sign” for millions of immigrant workers, many of them illegal.
If history is any guide, President Obama’s administrative order of amnesty will widen the gap between foreign-born and American-born population growth.
Edwin S. Rubenstein is President of ESR Research Economic Consultants.
This is a content archive of VDARE.com, which Letitia James forced off of the Internet using lawfare.