National Data | Trump’s Worst Failure? — April Jobs Show Record Immigrant Displacement Of American Workers, Continuing Disastrous Multi-Year Trend
05/07/2019
Funny thing, media commentary on employment almost never includes the immigration dimension — even now, when Democrats are desperate to downplay the strength of this cyclical recovery. Result: there’s absolutely no public awareness (except by VDARE.com readers) that continued immigrant displacement of American workers is emerging as one of President Trump’s worst policy failures.
Every month the Labor Department released two employment surveys: the Household Survey queries families directly, while the more widely cited Payroll Survey queries businesses. Total employment per the Household Survey is about 5 million more than found in the Payroll Survey, a gap that puzzles economists although we’ve long ago pointed out that it reflects employees, especially illegal immigrants, working “off the books.” Rarely has the divergence between the two surveys been as stark as it was in April, released on May 3. Essentially, immigrants (legal and illegal) captured ALL the new jobs.
Employers added 263,000 jobs last month, blowing past the 190,000 Payroll Survey gain analysts had expected. The unemployment rate was 3.6%, the lowest in half a century. Payrolls have now risen for 104 months in a row.
But, bizarrely, the Household Survey, which reports the nativity of workers, found a net job decline — of 103,000 in April. Our analysis indicates that native-born American workers suffered a job loss of more than half a million positions, while immigrants gained almost that much.
In April:
- Native-Born Americans lost 560,000 jobs, a 0.4% decline
- Immigrants gained 457,000 jobs, an increase of 1.6%
- Our immigrant employment index, set at 100.0 in January 2009, rose to 130.7 up from 128.6 in March.
- The Native-Born American employment index fell to 106.5 from 106.9 in March.
- The New VDARE American Worker Displacement Index (NVDAWDI), our name for the ratio of immigrant to native-born employment growth indexes, rose to 122.8 from 120.2 in March.
The April NVDAWDI was second highest among the 124 months we’ve tracked since January 2009. The all-time displacement high, 123.0, was set in April of last year. (It is curious that the past two Aprils appear to be such outliers, with large spikes in American Worker Displacement. It may reflect a seasonal surge in cross-border migration. There are no seasonal adjustments made to the immigrant and native-born employment figures published in the monthly employment report).
But the overall trend is all too clear: Native-born American workers lost ground to their foreign-born competitors throughout the Obama years; this accelerated significantly in the months leading up to the 2016 election. And more than half way through his first term, President Trump shows no sign of breaking the trend:
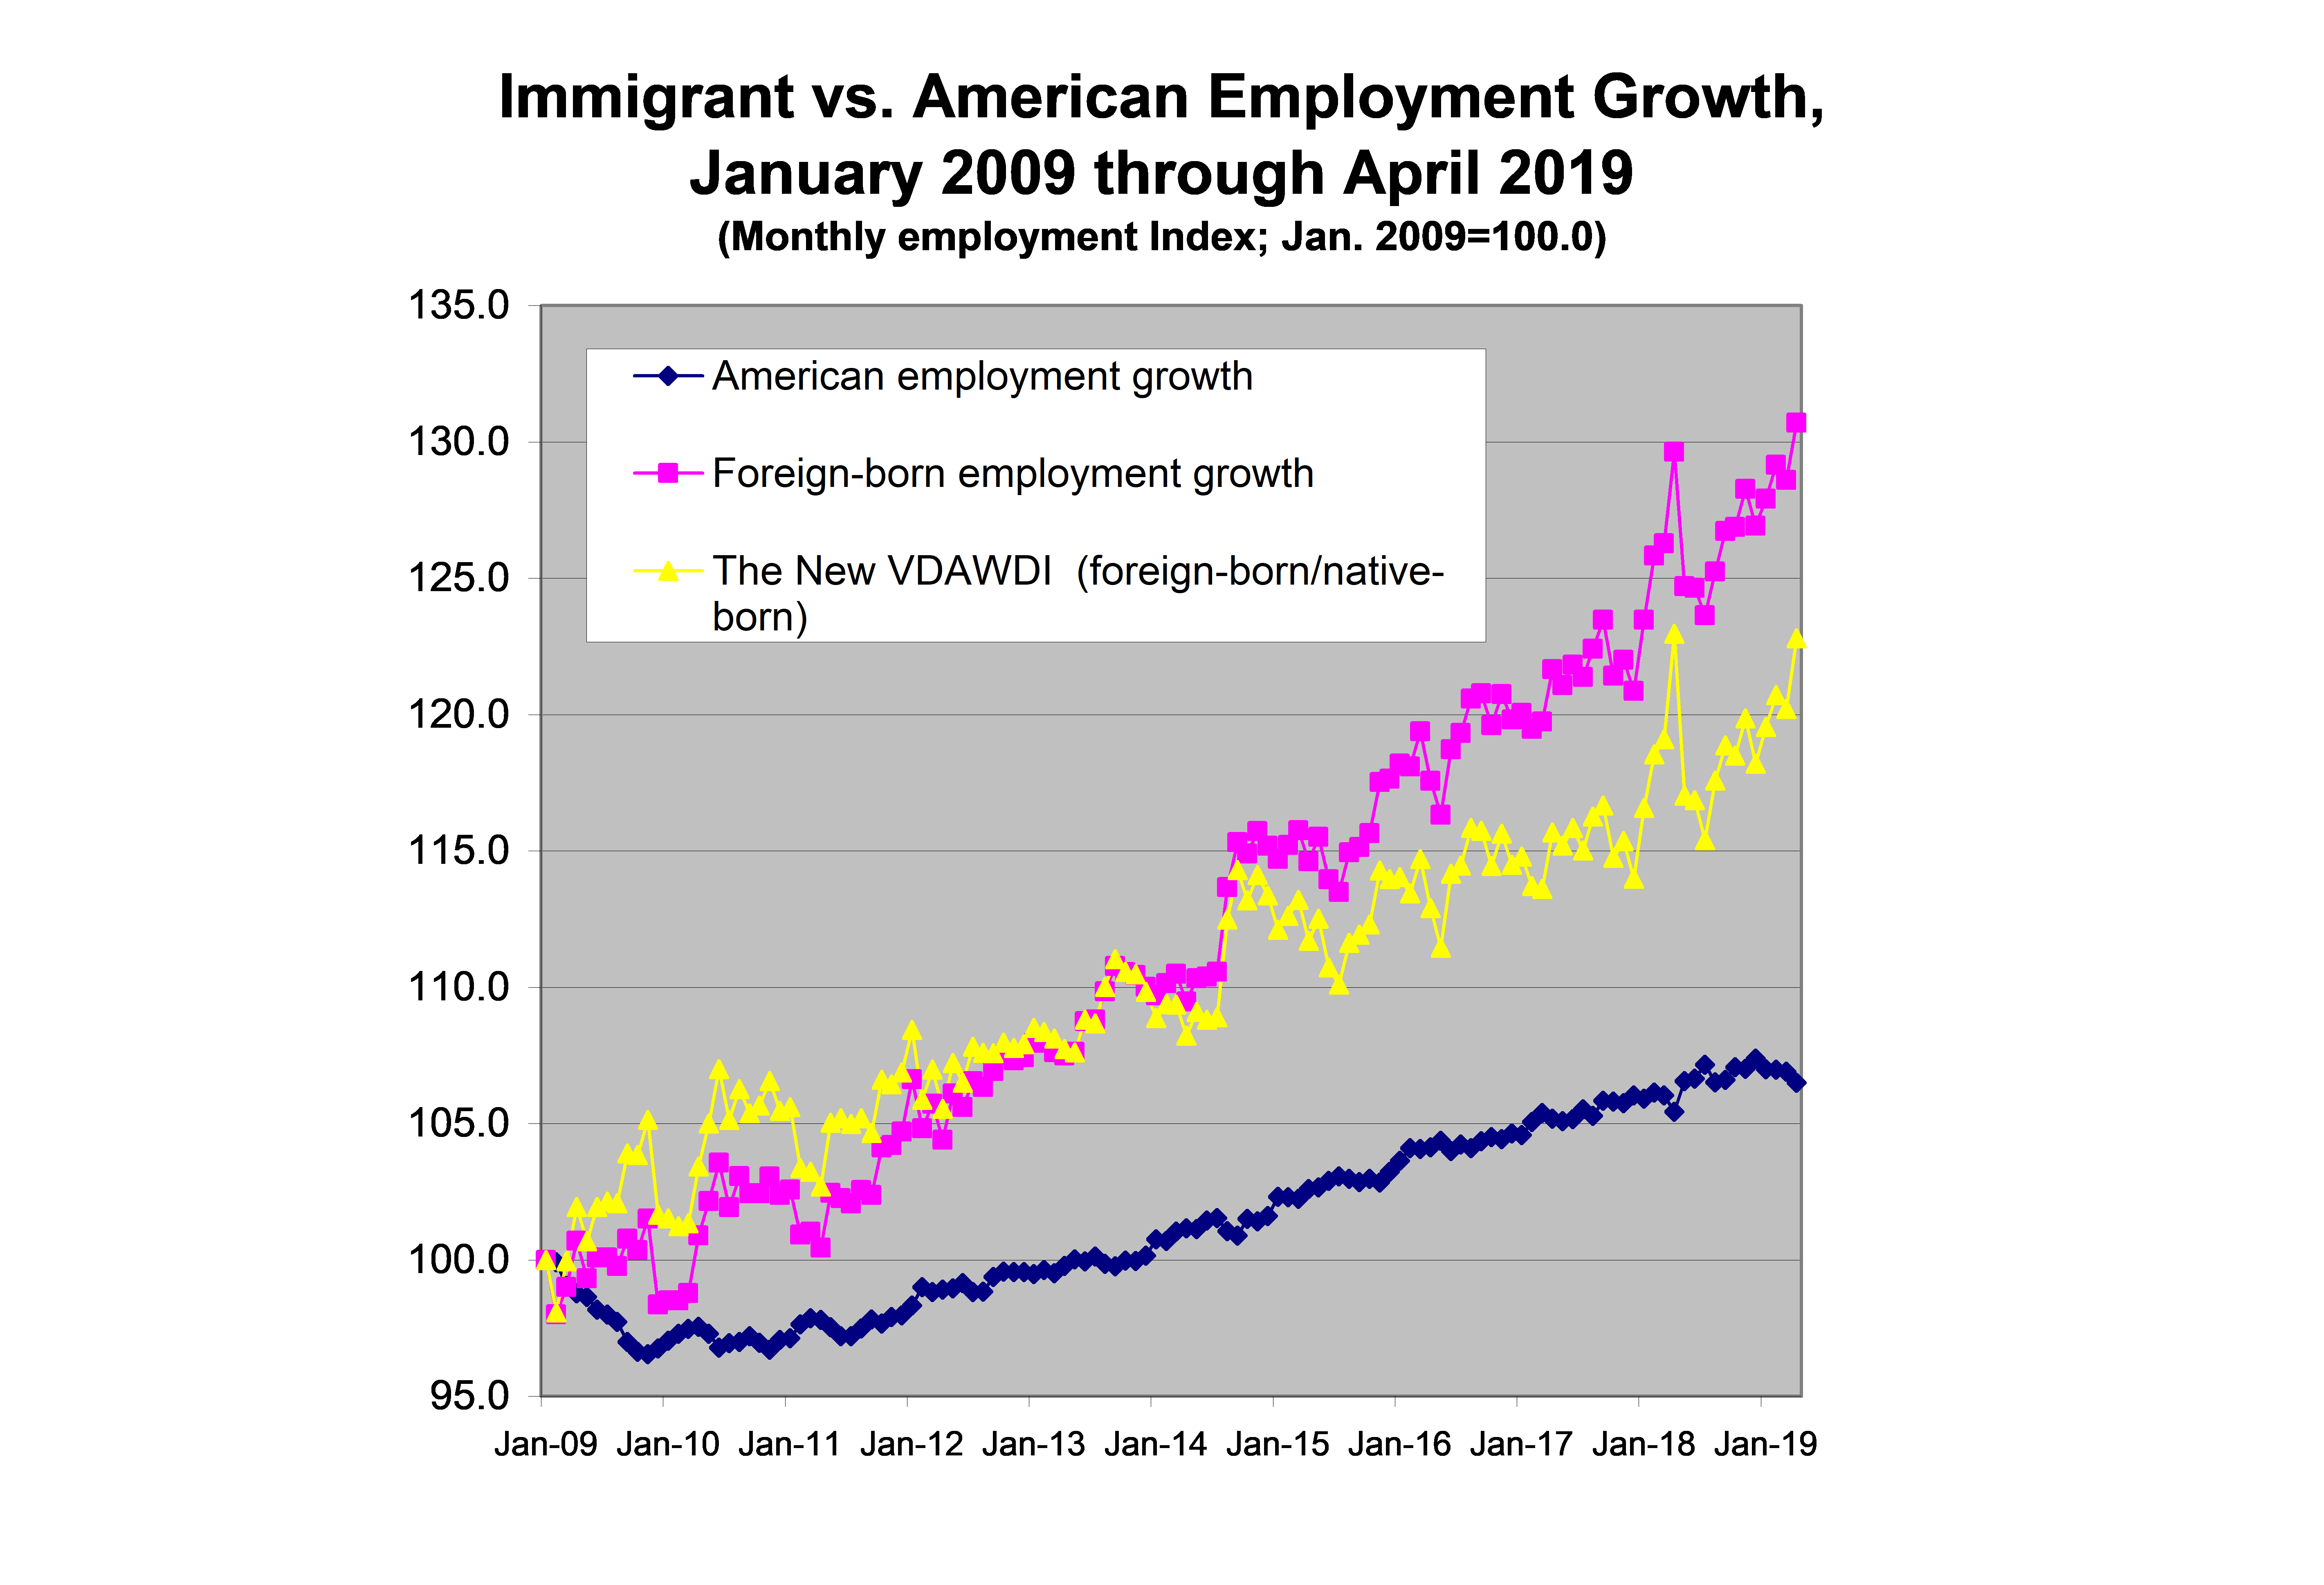
From January 2017 through April 2019, Trump has presided over a labor market in which immigrants gained 2.3 million jobs, an 8.9% increase, while native-born Americans gained 2.262 million, a rise of just 1.8%. As far as the jobs are concerned, “America First” has not translated into Americans First.
Another way of looking at American worker displacement: the immigrant share of total U.S. employment.
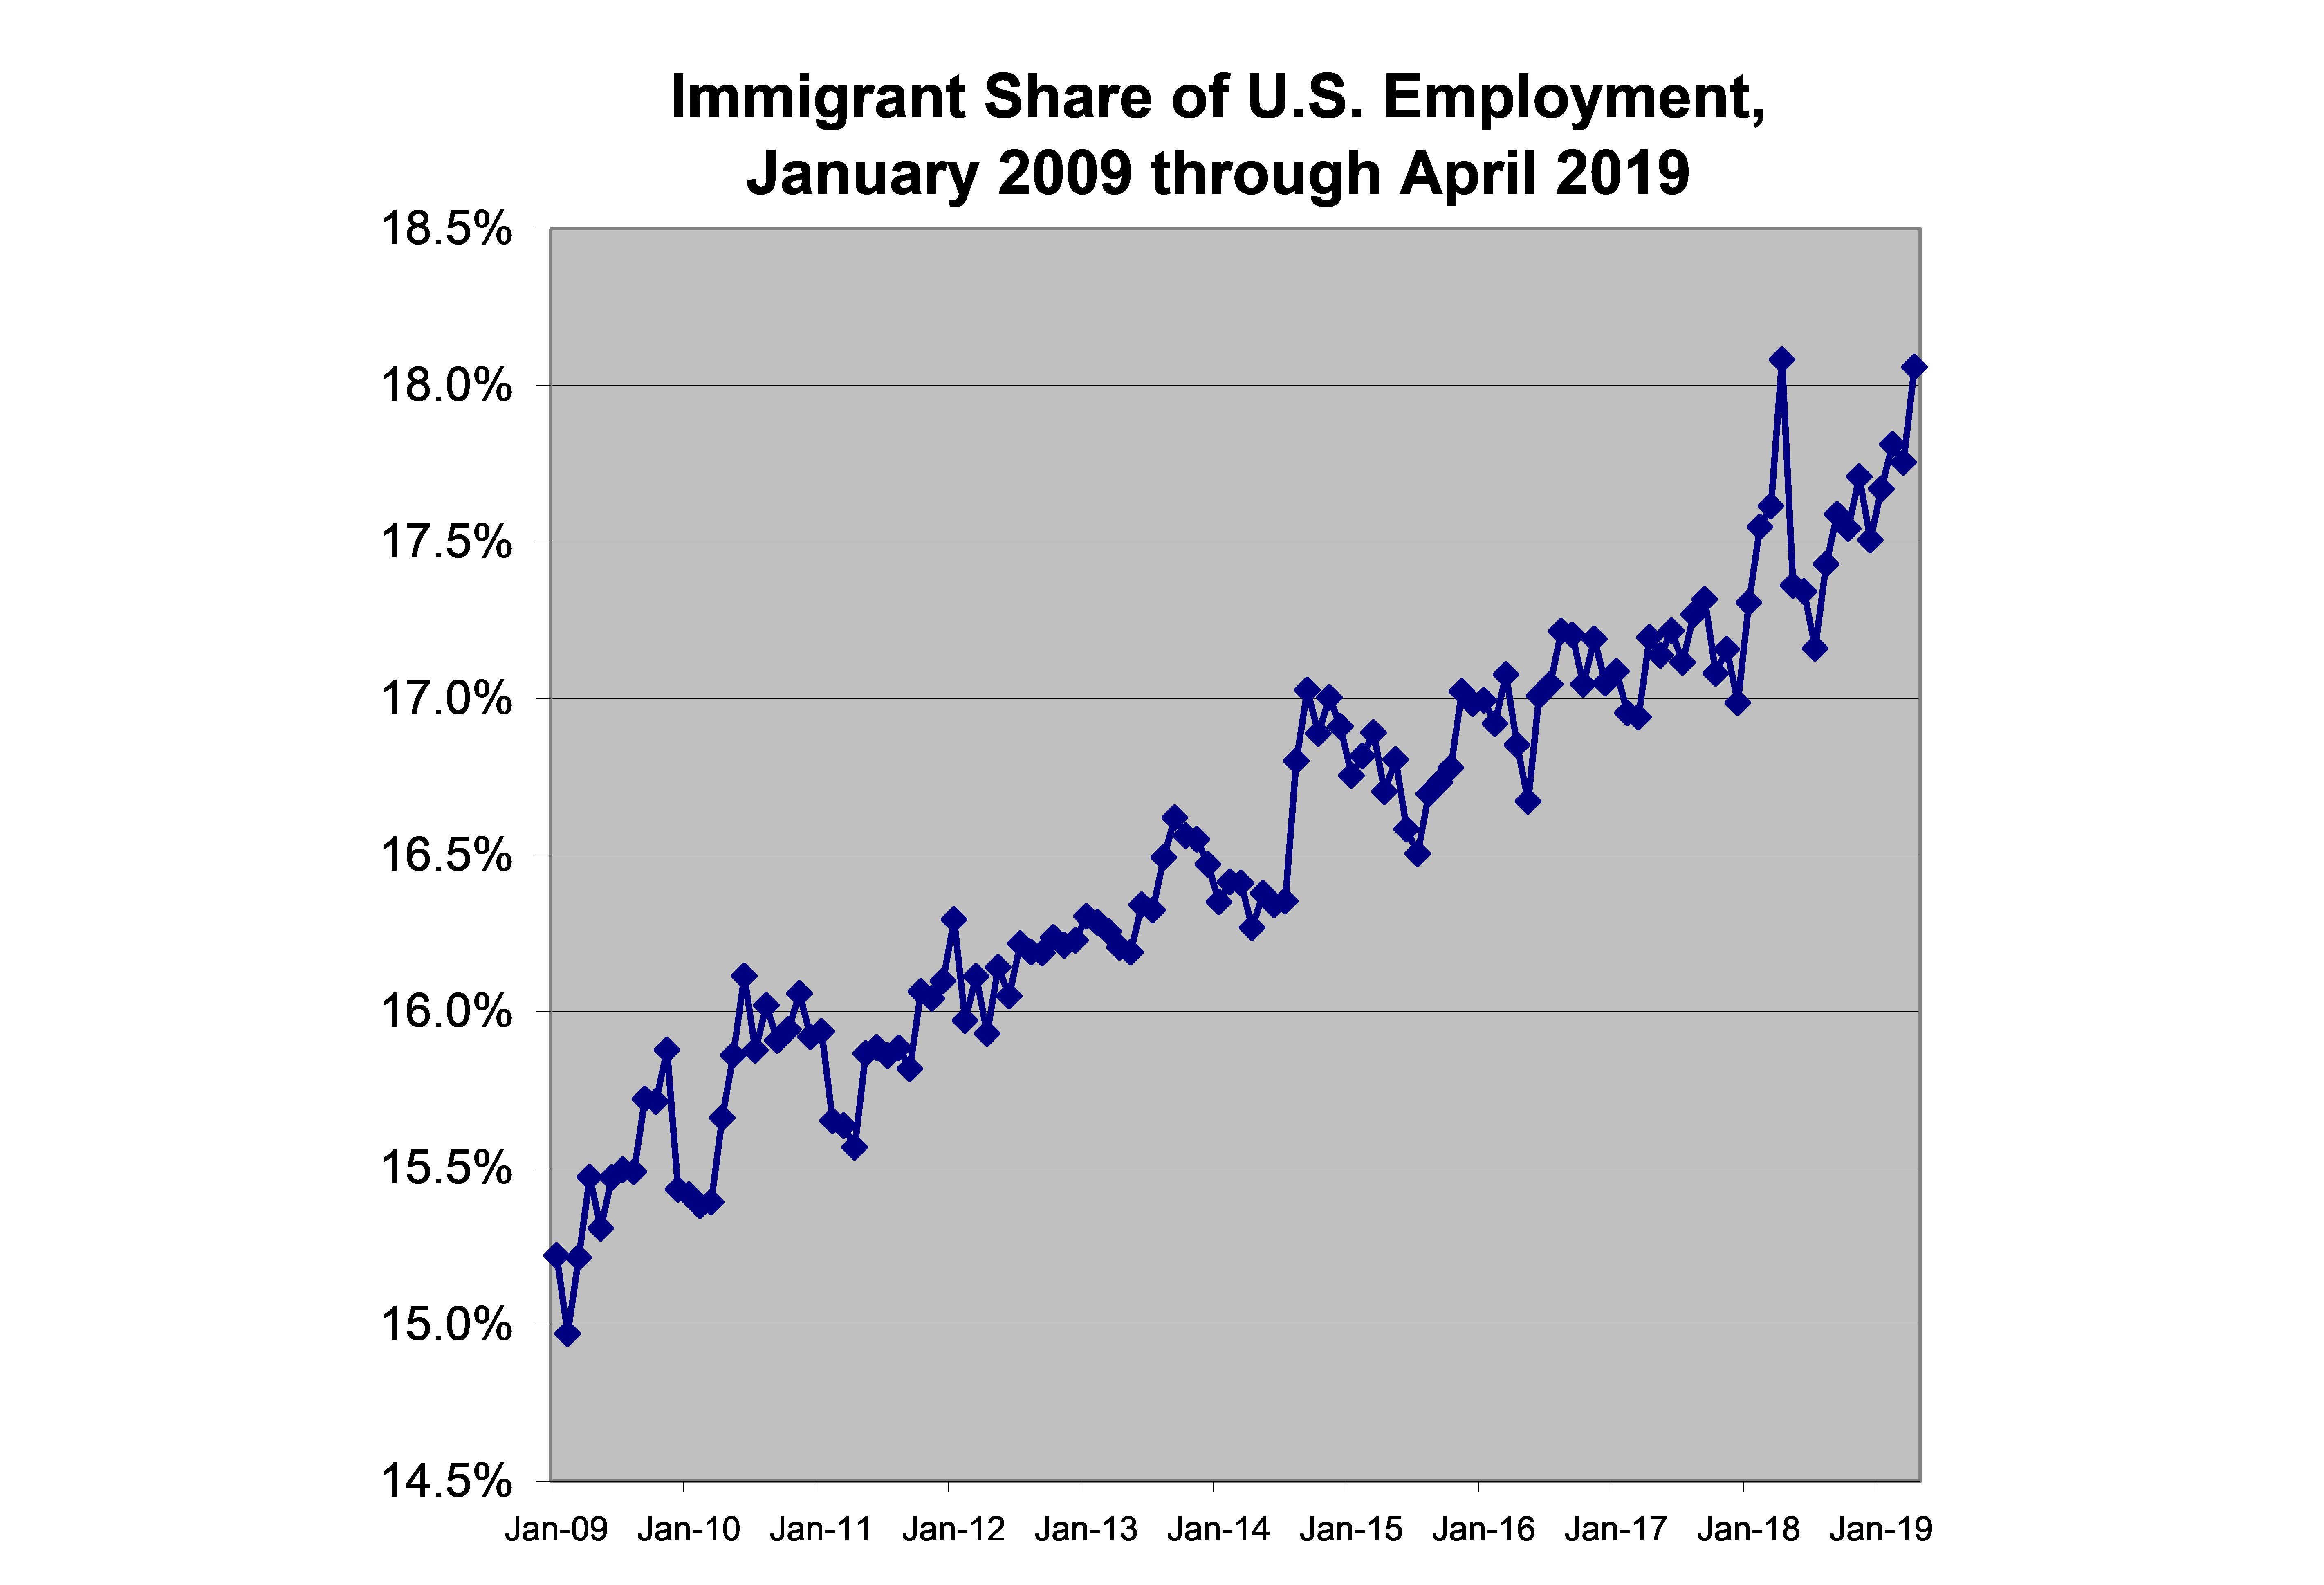
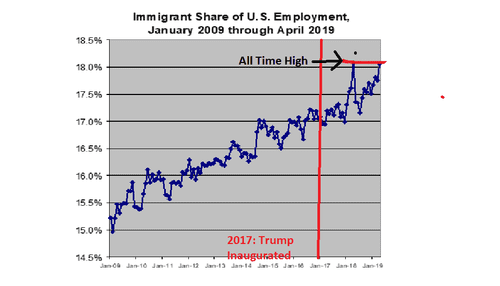
Immigrants held 18.06% of jobs in April 2019, a significant rise from their 17.75% share of March. The record immigrant job share — 18.08% — was also recorded in April of last year.
Of course, the best news in the April report: wage growth. For years wage increases have been tepid even as the economy added jobs and unemployment continued falling. But now employees finally appear to be getting raises. Average hourly earnings rose by 0.2%, which follows an increase of 0.1% in March. Over the past 12 months earnings have risen by a healthy 3.2%.
Note, however, that these recent gains look distinctly less impressive in a longer-term perspective. I’ll be charting this soon).
And the unemployment rate has been falling for years. Why did it take so long for wages to rise?
Economists increasingly believe the official unemployment rate is too narrow to capture the true slack in the labor market. It counts only people actively looking for work, which means it leaves out students, stay-at-home parents, people with partial disabilities, and others who might take jobs if wages were to rise above a certain threshold level.
If employers have been tapping into that broader pool of potential labor, it could help explain why they haven’t been forced to raise wages faster. But it is finally happening now.
Put differently, the Obama recovery was not strong enough to coax stay at homes off the couch and into the workforce. Trump has apparently changed that.
This tightening labor market, of course, is the reason President Javanka has apparently prevailed on Donald J. Trump to talk of increasing legal immigration, contrary to his campaign promises. [Republican senators to be briefed on Kushner’s immigration plan, AP, May 7, 2019]
But, as brought out in the Economic Policy Institute graphic below, these annual hikes in nominal wage growth, although returning to pre-Great Recession levels, are still below the Federal Reserve’s target for non-inflationary wage growth:
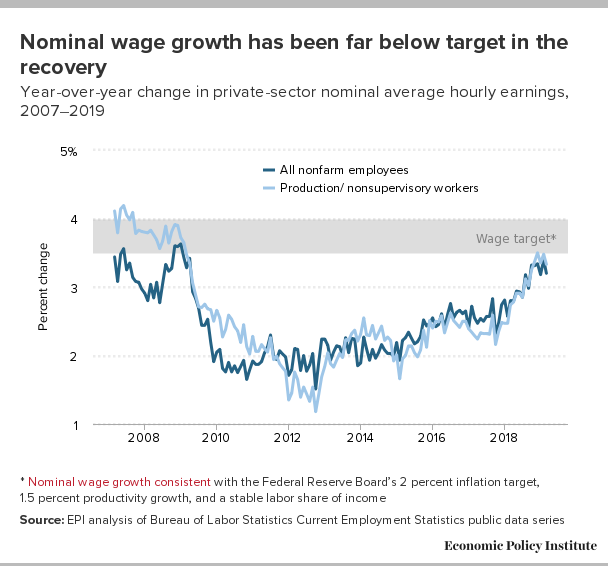
So the Leftist EPI and the studiously impartial National Data agree: wage growth is now recovering — but not as good as it should be.
What EPI won’t tell you: Immigration may be the reason. Even larger wage gains would have transpired had the immigrant share of employment not increased. Economist George Borjas estimates that every 10 percentage-point increase in the foreign-born share of employment reduces native-born Americans’ wages by 3% to 4%. [Immigration and the American Worker, by George Borjas, CIS.org, April 9, 2013, and Yes, Immigration Hurts American Workers, Politico, October 2016].
Since February 2009 the foreign-born share of employment has risen by about 2.9 percentage points — implying that wages would be growing about 1 percentage point above the 3.2% to 3.4% rate of recent months had an immigration moratorium been in effect since then.
In other words, the past 10 years of immigration have deprived American workers of a 33% wage hike.
A detailed picture of American worker displacement over the past year is available in the Employment Status of the Civilian Population by Nativity table published in the monthly BLS Report:
|
Employment Status by Nativity, April 2018-April 2019 |
||||
|
(numbers in 1000s; not seasonally adjusted) |
||||
|
Apr-18 |
Apr-19 |
Change |
% Change |
|
|
Foreign born, 16 years and older |
||||
|
Civilian population |
43,164 |
43,527 |
363 |
0.84% |
|
Civilian labor force |
28,266 |
28,439 |
173 |
0.61% |
|
Participation rate (LPR) |
65.5% |
65.3% |
-0.2 pts.. |
-0.31% |
|
Employed |
27,300 |
27,660 |
360 |
1.32% |
|
Employment/population % |
63.2 |
63.5 |
0.3pts. |
0.47% |
|
Unemployed |
967 |
779 |
-188 |
-19.44% |
|
Unemployment rate (%) |
3.4 |
2.7 |
-0.7pts. |
-20.59% |
|
Not in labor force |
14,898 |
15,088 |
190 |
1.28% |
|
Native born, 16 years and older |
||||
|
Civilian population |
214,107 |
215,166 |
1,059 |
0.49% |
|
Civilian labor force |
133,014 |
133,657 |
643 |
0.48% |
|
Participation rate (LPR) |
62.1% |
62.1% |
0.0pts. |
0.00% |
|
Employed |
128,049 |
129,049 |
1,000 |
0.78% |
|
Employment/population % |
59.8% |
60.0% |
0.2pts. |
0.33% |
|
Unemployed |
4,965 |
4,608 |
-357 |
-7.19% |
|
Unemployment rate (%) |
3.7 |
3.4 |
-0.3pts. |
-8.11% |
|
Not in labor force |
81,094 |
81,509 |
415 |
0.51% |
|
Source: BLS, The Employment Situation April 2019, Table A-7, May 3, 2019. |
||||
Over the past 12 months (April 2018 to April 2019):
- Immigrant employment rose 1.32%; native-born American employment was up 0.78%. IMMIGRANT EMPLOYMENT GREW AT EARLY TWICE THE RATE OF NATIVE-BORN AMERICANS
- The immigrant labor force (employed plus looking for work) rose 0.61%; the native-born labor force grew 0.48% — ADVANTAGE IMMIGRANTS, POSSIBLY ATTRIBUTABLE TO THE CURRENT CROSS-BORDER SURGE IN ILLEGAL ECONOMIC MIGRANTS SEEKING JOBS
- The Labor Force Participation Rate (LPR), a sign of worker confidence and mobility, declined by 0.2 points, to 65.3% for immigrants, but was UNCHANGED, at 62.1%, for native-born Americans. ADVANTAGE NATIVE-BORN
- The unemployment rate for native-born American workers fell to 3.4%, a decline of 8.11%; immigrant unemployment fell to a miniscule 2.7%, a whopping 21% decline from the prior April. BIG ADVANTAGE IMMIGRANTS
Meanwhile, an increasingly porous southern border threatens further displacement losses.
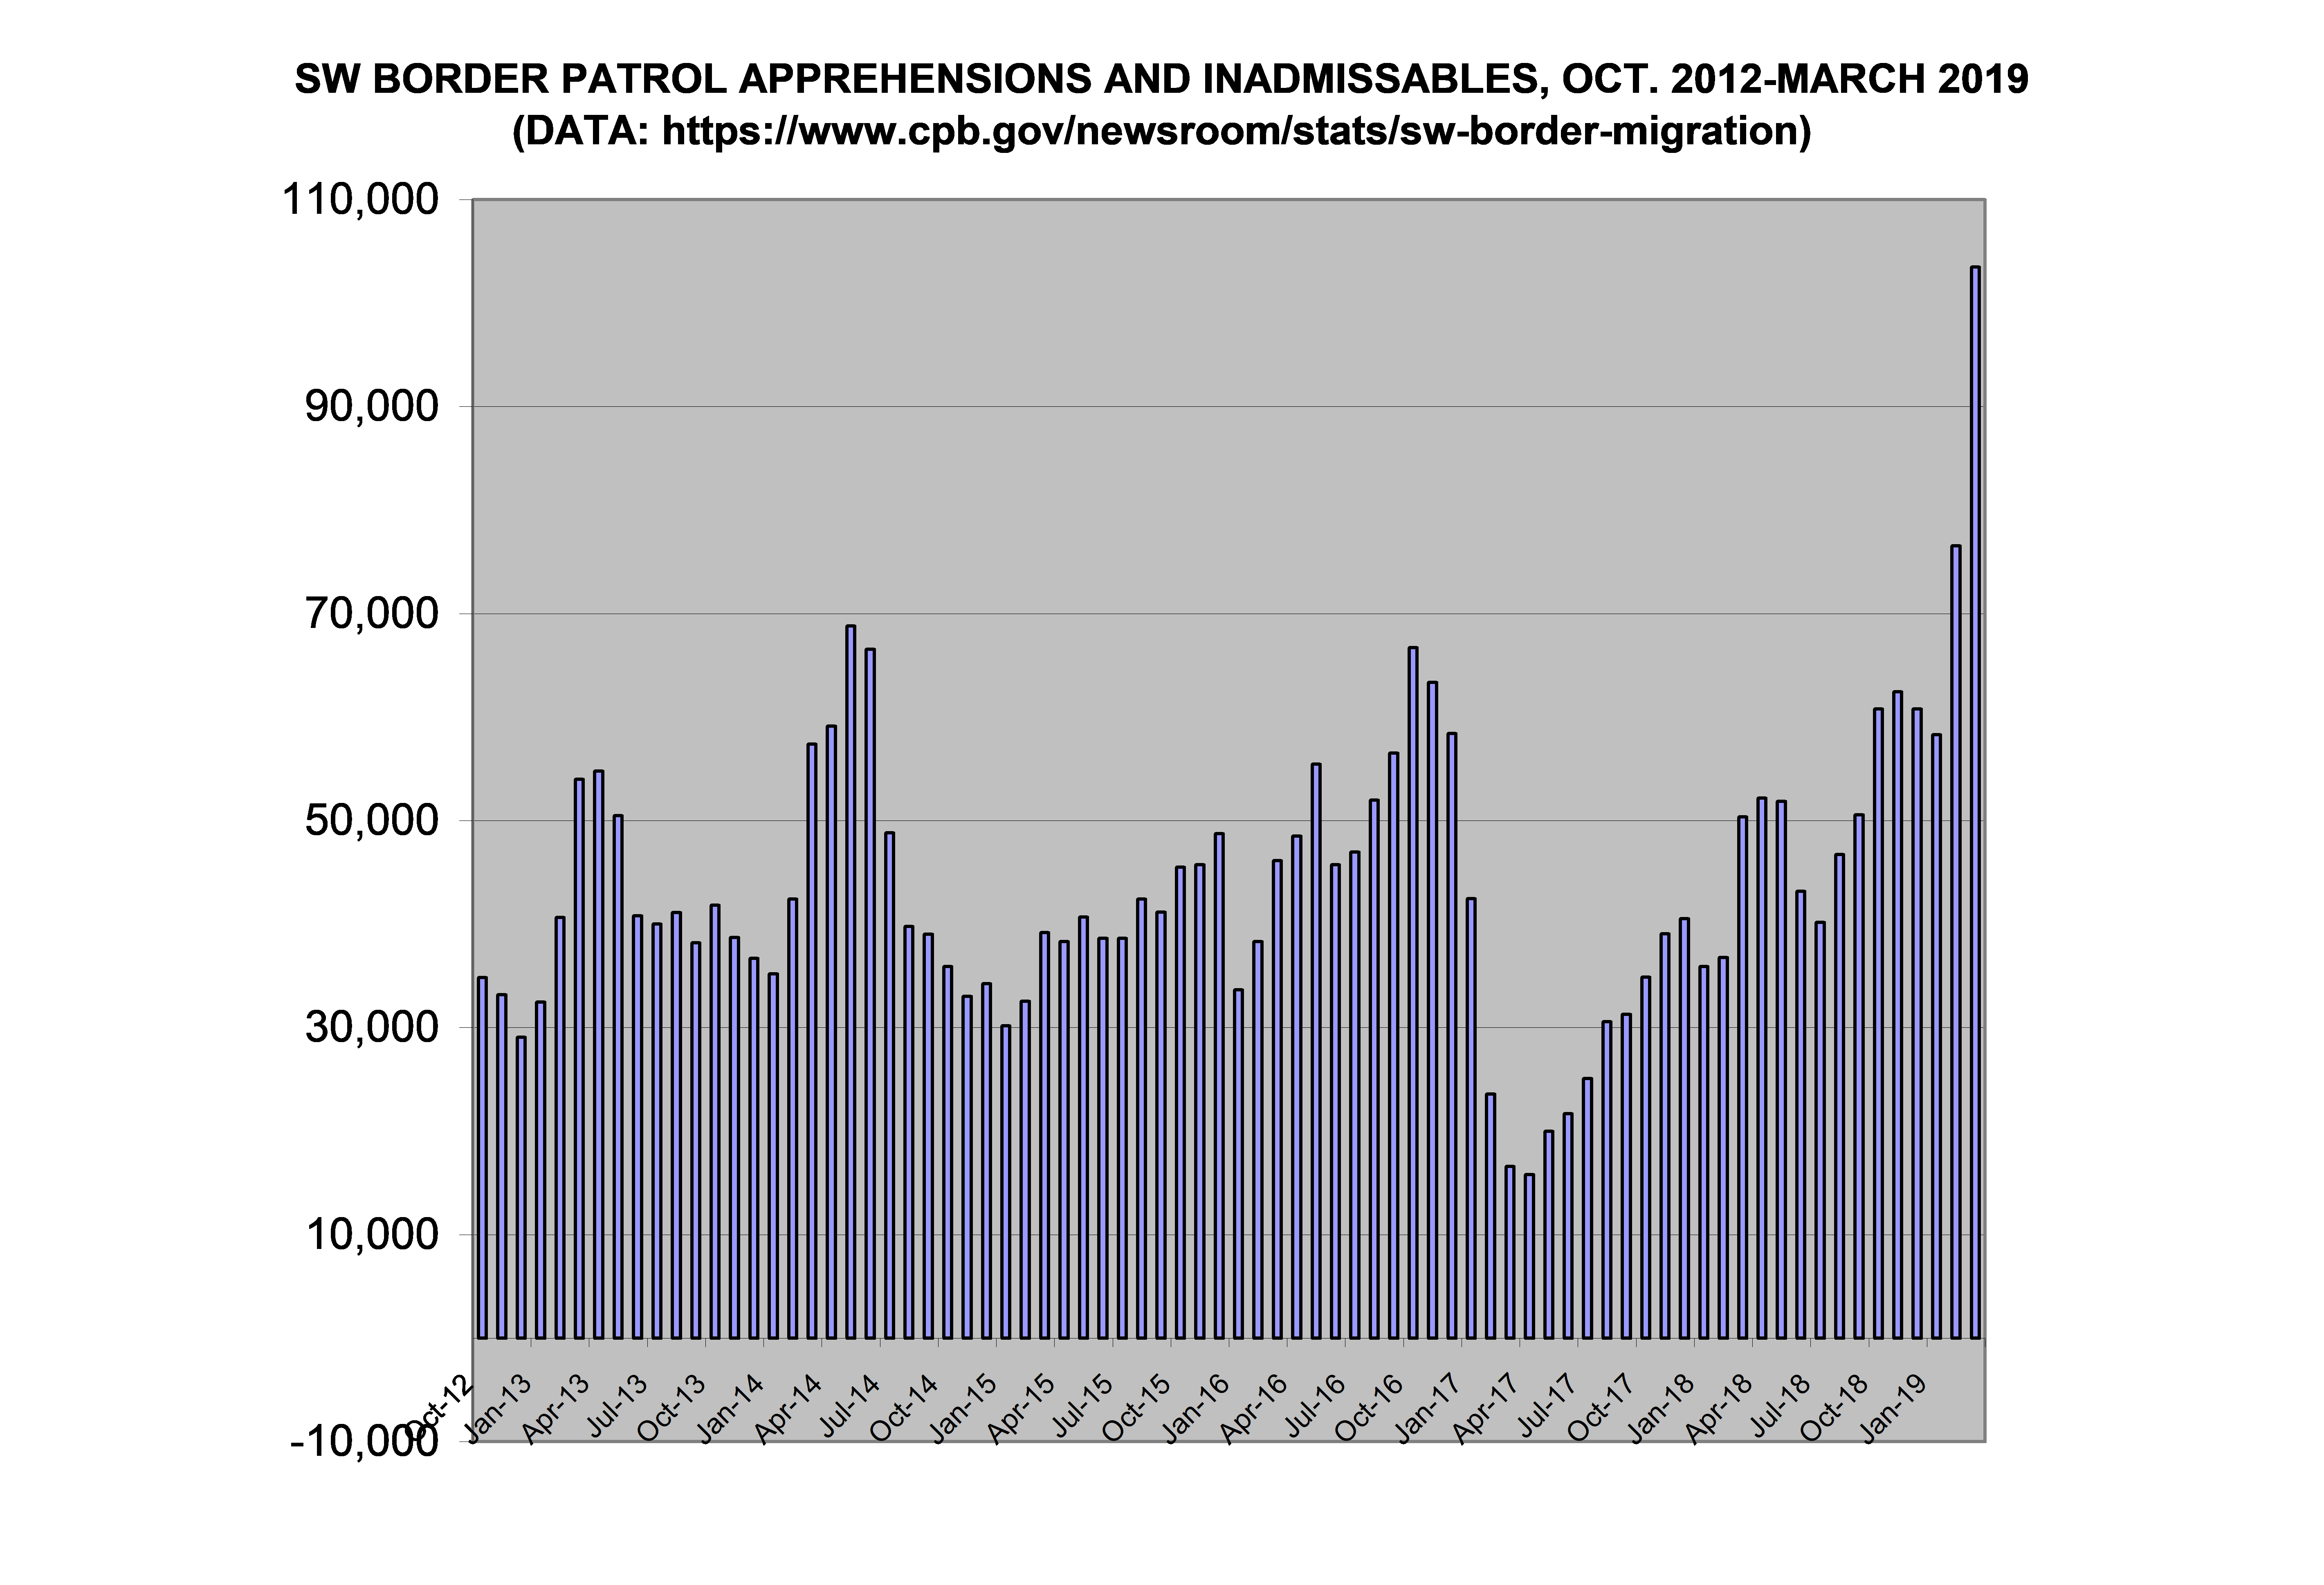
Border Patrol personnel apprehended 103,492 illegal crossers along the southwest border in March. In the first three months of 2019 a total of 238,320 were apprehended — nearly twice the number caught over the same period in 2018.
It’s clear that, because of a combination of judicial sabotage, Congressional inaction, and insufficient executive action, 2017’s promising “Trump Effect” has completely evaporated and the southern border has now collapsed. [Trump Vowed to Slow Border Crossings. Now They've Hit a 12-Year High, by Brian Bennet, Time, April 10, 2019].
Prudence dictates that we treat this for what it appears to be at this moment: a national emergency.
To repeat National Data’s traditional conclusion: Over the long haul, only legislation can protect American workers from displacement and wage depression. Trump lost his best chance to legislate patriotic immigration reform when the GOP lost the House. But he can still use the GOP Senate majority to “begin the conversation.”
Far from increasing immigration, he should demand an immigration moratorium.
A further thought: has everyone forgotten that the current immigration-driven demographic drift is suicidal for the GOP?
The Democrats haven’t — that’s why they won’t draw attention to immigration’s role in Trump’s American worker displacement failure.
Edwin S. Rubenstein (email him) is President of ESR Research Economic Consultants
